Fig. 7
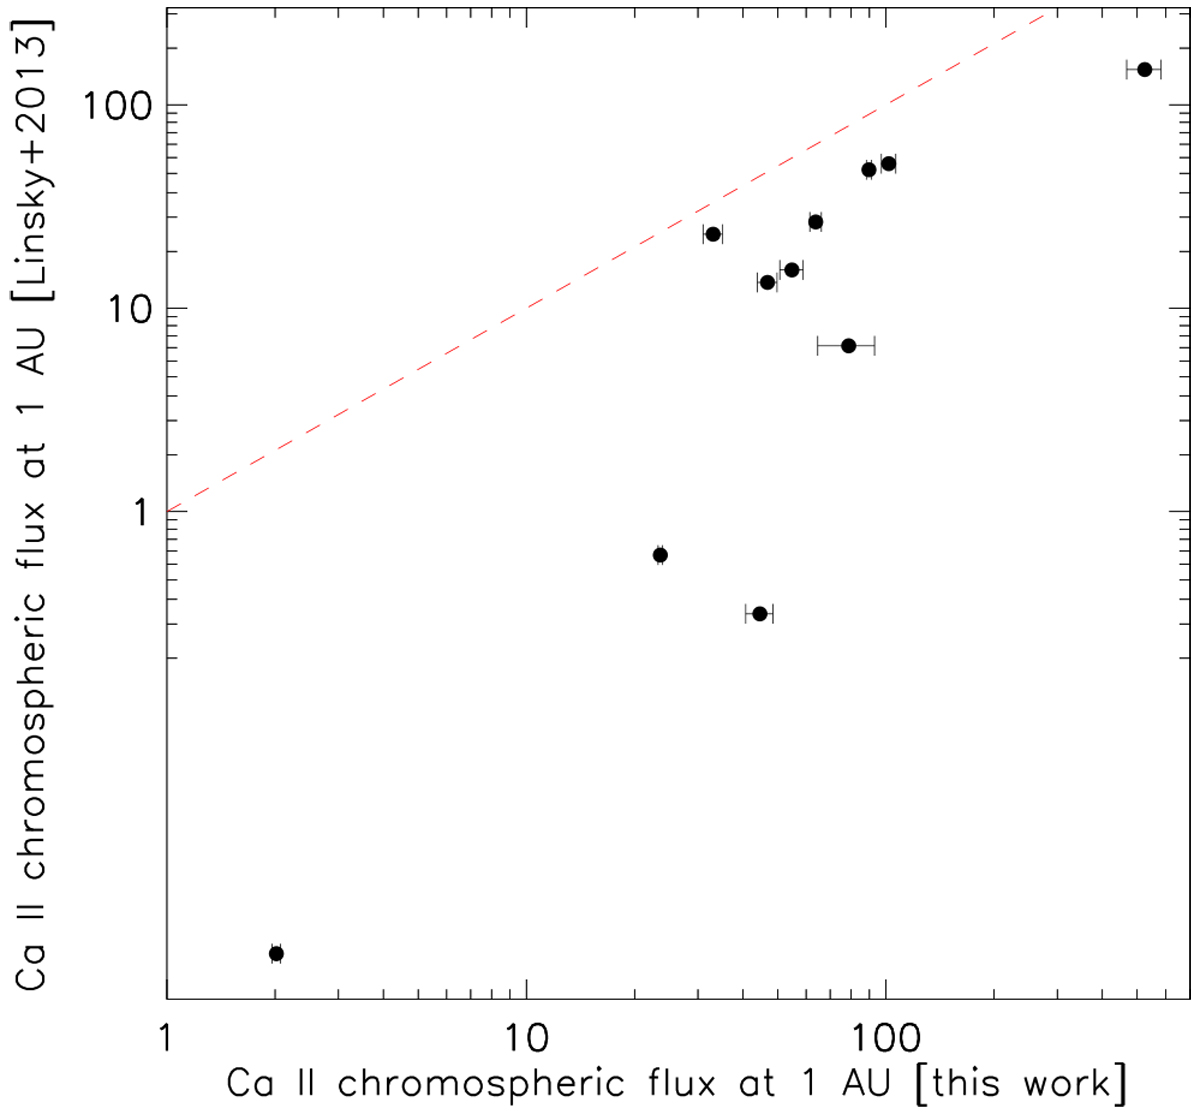
Comparison between Ca II H&K chromospheric emission flux at 1 AU calculated from
![]() employing the method described in Sect. 4 and that used in Linsky et al. (2013). The dashed red line represents the linear relation. We observe that the method described in Sect. 4 overestimates the Ca II H&K chromospheric emission flux as compared to those provided in Linsky et al. (2013).
employing the method described in Sect. 4 and that used in Linsky et al. (2013). The dashed red line represents the linear relation. We observe that the method described in Sect. 4 overestimates the Ca II H&K chromospheric emission flux as compared to those provided in Linsky et al. (2013).
Current usage metrics show cumulative count of Article Views (full-text article views including HTML views, PDF and ePub downloads, according to the available data) and Abstracts Views on Vision4Press platform.
Data correspond to usage on the plateform after 2015. The current usage metrics is available 48-96 hours after online publication and is updated daily on week days.
Initial download of the metrics may take a while.