Fig. 6
Correlation between EUV and ![]() activity parameters following the conversion of the
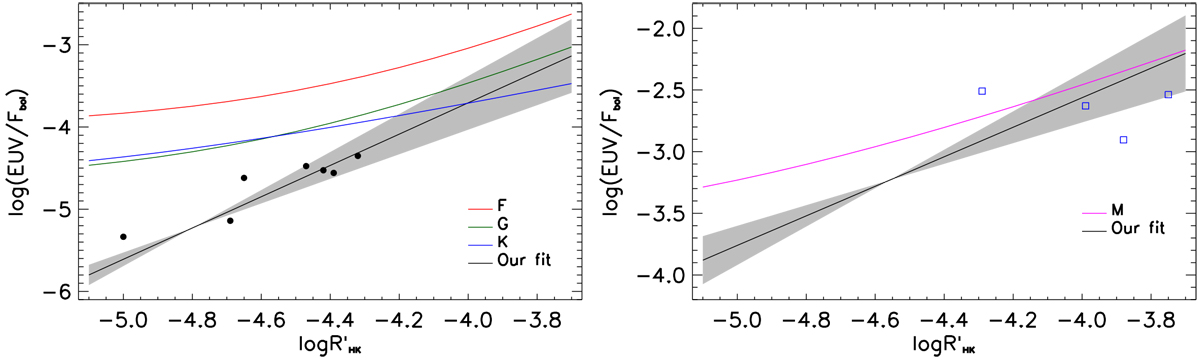
activity parameters following the conversion of the ![]() value into Ca II H&K chromospheric emission fluxes and following the scaling relations from Linsky et al. (2013, 2014) for F- (red), G- (green), K- (blue), and M-type (magenta) stars. The black line and grey shaded area are the linear fits obtained for F-, G-, and K-type stars (left) and for M-type stars (right) and shown in Fig. 5. The black dots (left) and open blue squares (right) indicate the position of the stars that are both in Linsky et al. (2014) and our sample; the
log (EUV∕Fbol) values are from Linsky et al. (2014). For inactive stars, deriving the EUV fluxes from the
value into Ca II H&K chromospheric emission fluxes and following the scaling relations from Linsky et al. (2013, 2014) for F- (red), G- (green), K- (blue), and M-type (magenta) stars. The black line and grey shaded area are the linear fits obtained for F-, G-, and K-type stars (left) and for M-type stars (right) and shown in Fig. 5. The black dots (left) and open blue squares (right) indicate the position of the stars that are both in Linsky et al. (2014) and our sample; the
log (EUV∕Fbol) values are from Linsky et al. (2014). For inactive stars, deriving the EUV fluxes from the
![]() values by employing the scaling relations from Linsky et al. (2013, 2014) leads to overestimations of about one order of magnitude.
values by employing the scaling relations from Linsky et al. (2013, 2014) leads to overestimations of about one order of magnitude.
Current usage metrics show cumulative count of Article Views (full-text article views including HTML views, PDF and ePub downloads, according to the available data) and Abstracts Views on Vision4Press platform.
Data correspond to usage on the plateform after 2015. The current usage metrics is available 48-96 hours after online publication and is updated daily on week days.
Initial download of the metrics may take a while.