Fig. 3
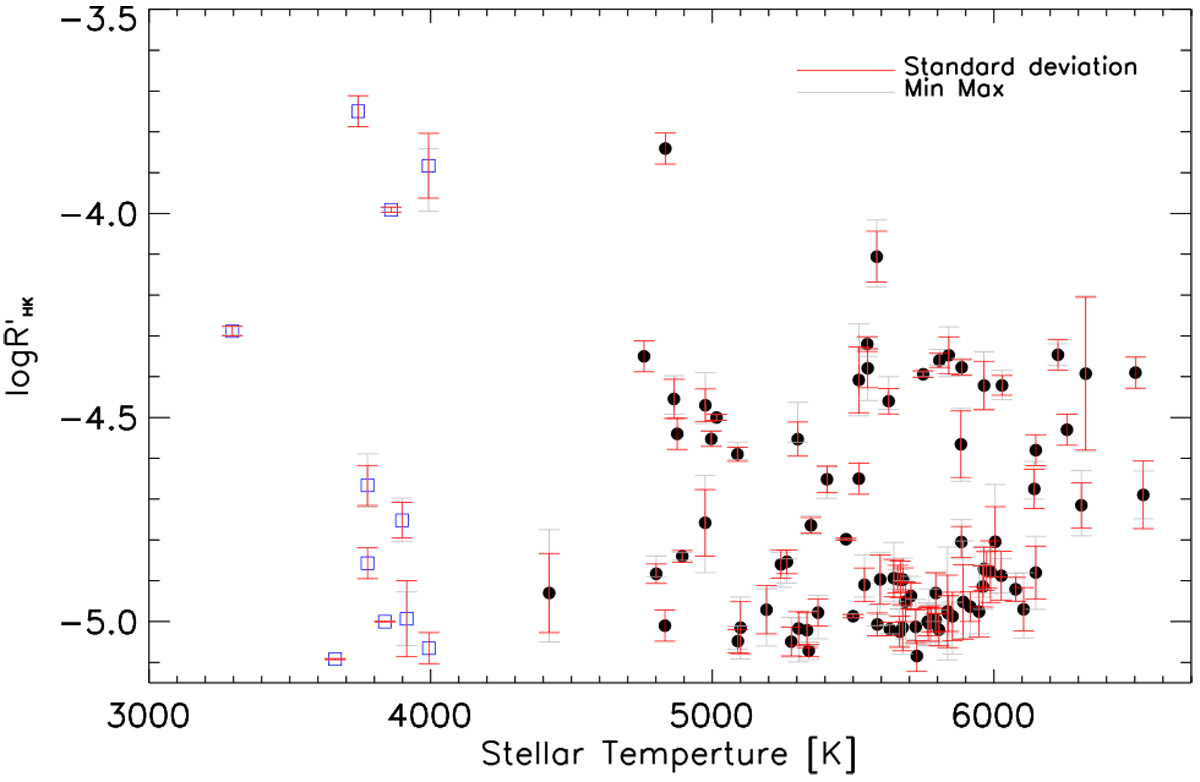
Median ![]() values following outlier removal as a function of stellar effective temperature. Black dots are for F-, G-, and K-type stars, and open blue squares are for M-type stars. The red error bars indicate the standard deviation of the
values following outlier removal as a function of stellar effective temperature. Black dots are for F-, G-, and K-type stars, and open blue squares are for M-type stars. The red error bars indicate the standard deviation of the
![]() measurements, while the grey error bars indicate the minimum and maximum
measurements, while the grey error bars indicate the minimum and maximum ![]() values collected from the literature and following outlier removal. For stars with a single
values collected from the literature and following outlier removal. For stars with a single
![]() measurement, the standard deviation is the median value of the standard deviation obtained for all stars in the sample and shown by the dashed red line in Fig. 2.
measurement, the standard deviation is the median value of the standard deviation obtained for all stars in the sample and shown by the dashed red line in Fig. 2.
Current usage metrics show cumulative count of Article Views (full-text article views including HTML views, PDF and ePub downloads, according to the available data) and Abstracts Views on Vision4Press platform.
Data correspond to usage on the plateform after 2015. The current usage metrics is available 48-96 hours after online publication and is updated daily on week days.
Initial download of the metrics may take a while.