Fig. 1
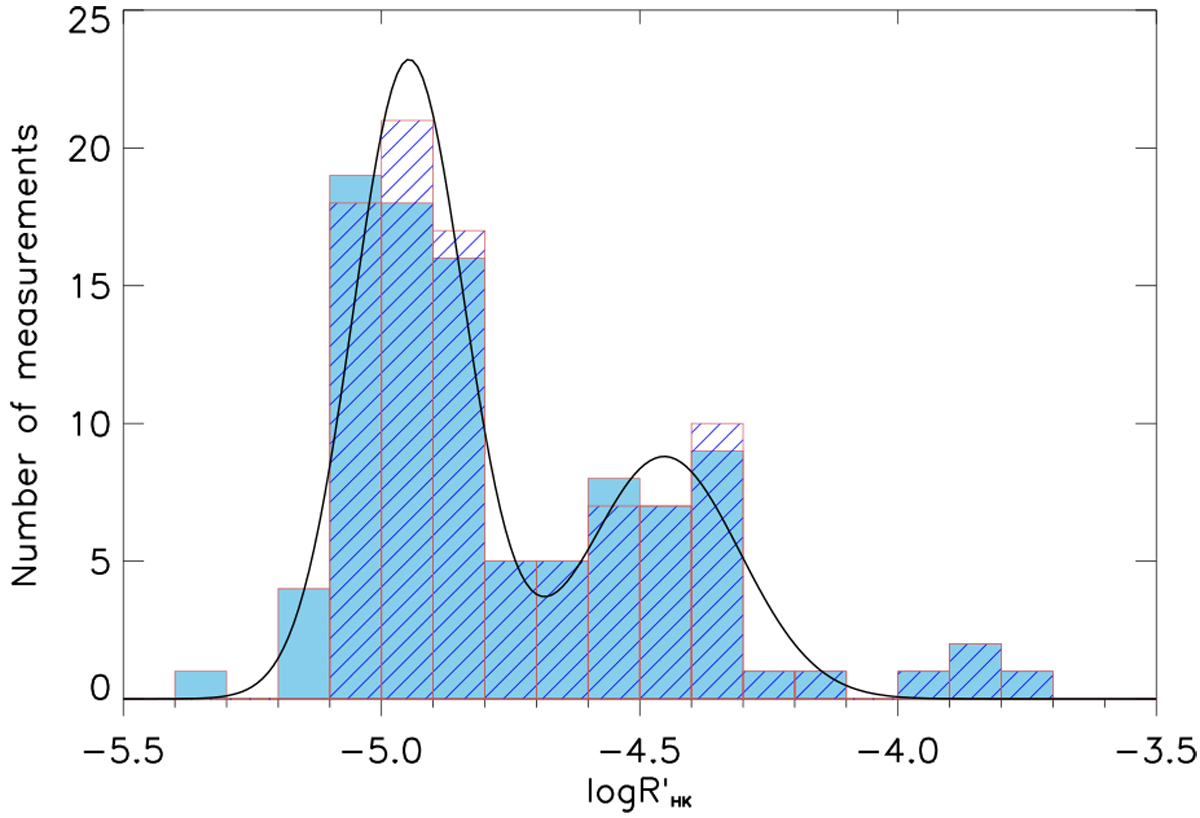
Distribution of the median ![]() values for all stars considered in this work before outlier removal (blue shaded; 99 stars, five stars from our initial sample had no
values for all stars considered in this work before outlier removal (blue shaded; 99 stars, five stars from our initial sample had no
![]() values in the literature) and after (hatched; 96 stars), namely following the removal of the values lying below the basal level and following the sigma clipping based on the MAD. The solid black line shows the double Gaussian fit to the
values in the literature) and after (hatched; 96 stars), namely following the removal of the values lying below the basal level and following the sigma clipping based on the MAD. The solid black line shows the double Gaussian fit to the
![]() distribution obtained following outlier removal.
distribution obtained following outlier removal.
Current usage metrics show cumulative count of Article Views (full-text article views including HTML views, PDF and ePub downloads, according to the available data) and Abstracts Views on Vision4Press platform.
Data correspond to usage on the plateform after 2015. The current usage metrics is available 48-96 hours after online publication and is updated daily on week days.
Initial download of the metrics may take a while.