Fig. 8
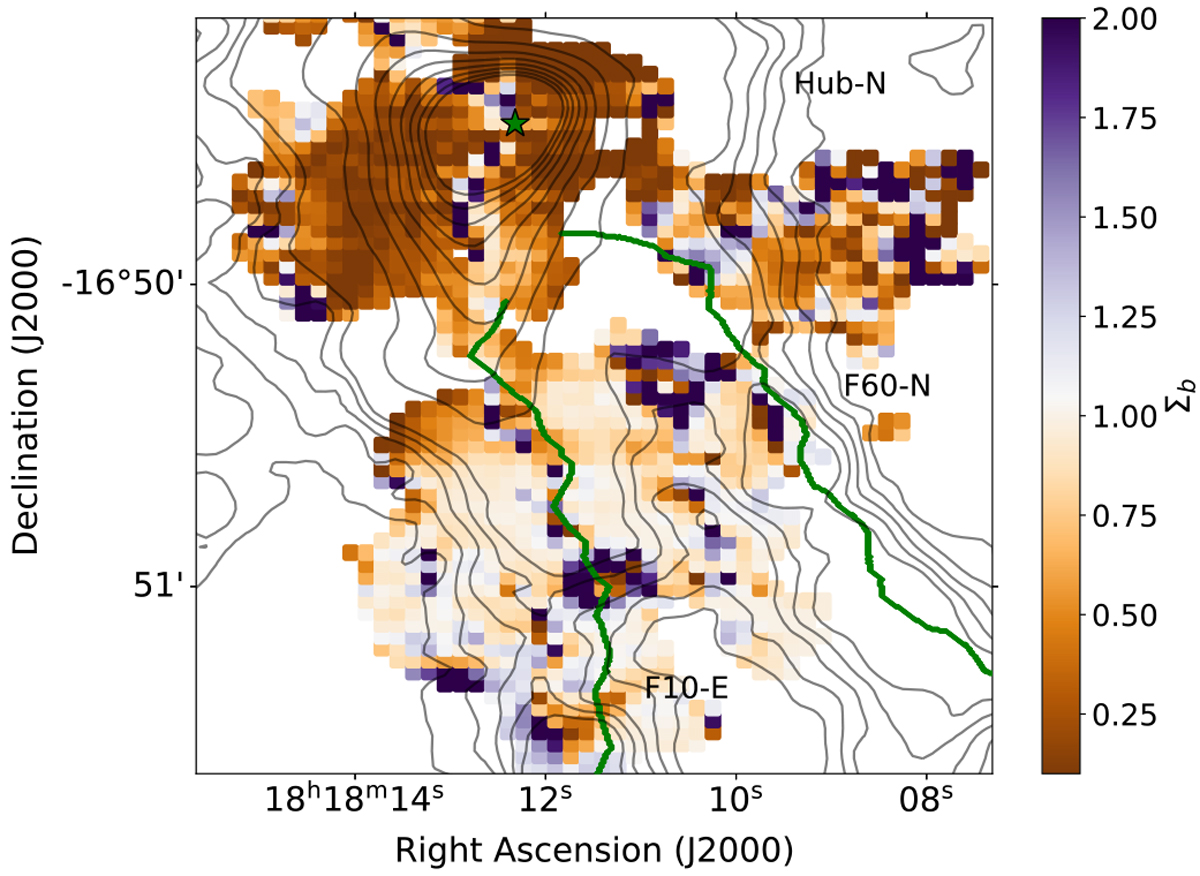
Spatial distribution of the B-field-to-gravity force ratio, ΣB, toward Hub-N. Contour levels, symbols, and lines are the same as in Fig. 7. We note that while in the hub there is a smooth transition of the values of ΣB, in the boundaries of the hub and in the south of the map there are pixels with outliers. In these regions, there is a noisy intensity gradient (see Fig. 6) that is likely due to the absence of a dominant center of gravity at these positions.
Current usage metrics show cumulative count of Article Views (full-text article views including HTML views, PDF and ePub downloads, according to the available data) and Abstracts Views on Vision4Press platform.
Data correspond to usage on the plateform after 2015. The current usage metrics is available 48-96 hours after online publication and is updated daily on week days.
Initial download of the metrics may take a while.