Fig. 7
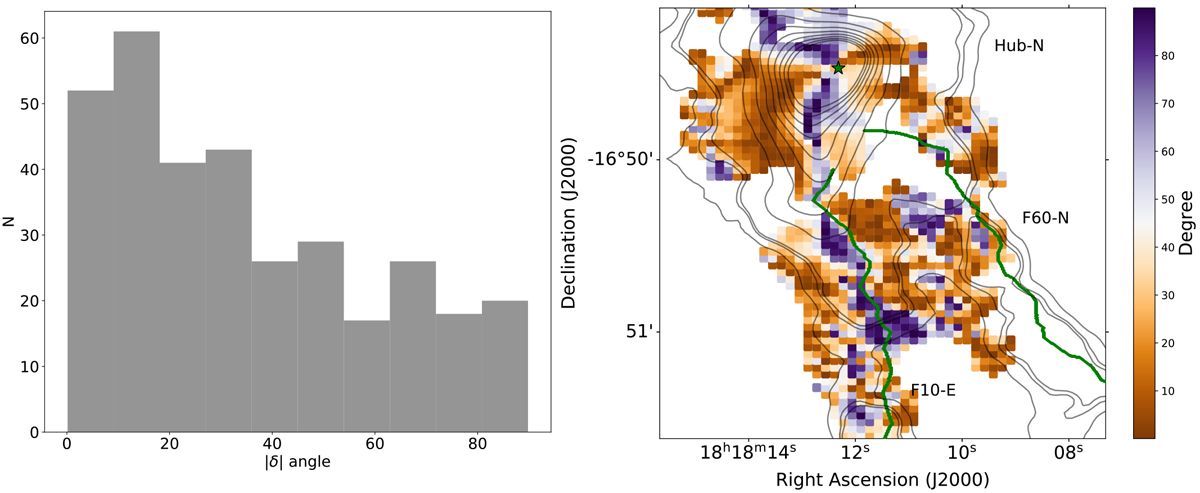
Left: histogram of the absolute difference, |δ|, between the position angles of magnetic field and intensity gradient in the range from 0° to 90°. Right: |δ| map toward Hub-N (color scale) overlaid on the 350 μm dust emission. Contour levels range from 2σ to 10σ in steps of 2σ and from 10σ to 100σ in steps of 10σ, where σ is the rms noise of the map (~80 mJy beam−1). The green star and the green solid line depict the MM1a core position and the spine of the filament, respectively, similar to Fig. 6.
Current usage metrics show cumulative count of Article Views (full-text article views including HTML views, PDF and ePub downloads, according to the available data) and Abstracts Views on Vision4Press platform.
Data correspond to usage on the plateform after 2015. The current usage metrics is available 48-96 hours after online publication and is updated daily on week days.
Initial download of the metrics may take a while.