Fig. 6
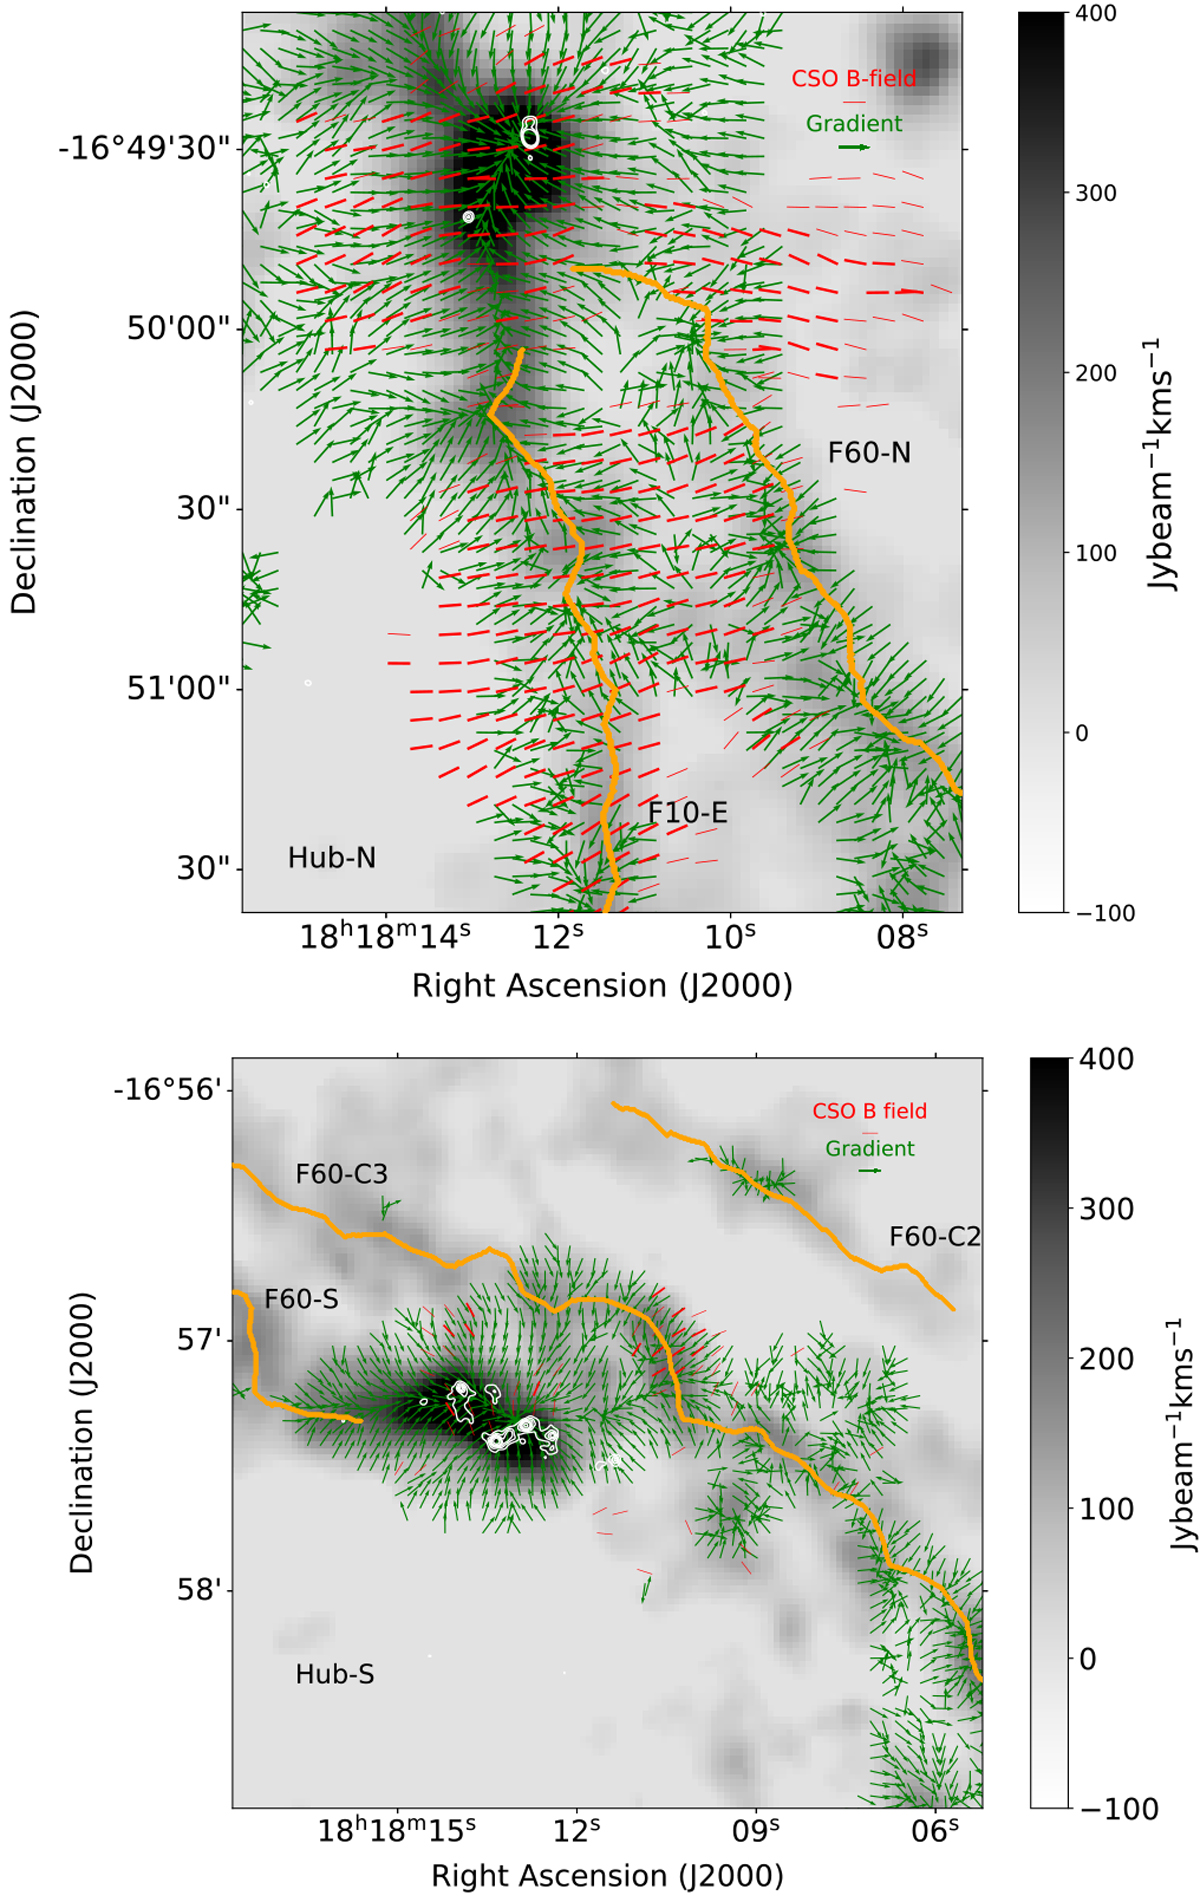
NH3 moment-zero map (grayscale; Busquet et al. 2013) overlaid on the magnetic field segments (red) and the intensity gradient vectors (green, uniform length) from dust continuum for Hub-N (upper panel) and Hub-S (lower panel). We have restricted the representation of the gradient to the areas where the emission exceeds three times the rms noise of the continuum map. White contours correspond to the SMA 1.3 mm dust continuum emission (Busquet et al. 2016), similar to Fig. 5. The orange lines depict the spine of the filaments identified in N2H+ by Chen et al. (2019) and are labeled according to Busquet et al. (2013).
Current usage metrics show cumulative count of Article Views (full-text article views including HTML views, PDF and ePub downloads, according to the available data) and Abstracts Views on Vision4Press platform.
Data correspond to usage on the plateform after 2015. The current usage metrics is available 48-96 hours after online publication and is updated daily on week days.
Initial download of the metrics may take a while.