Fig. 5
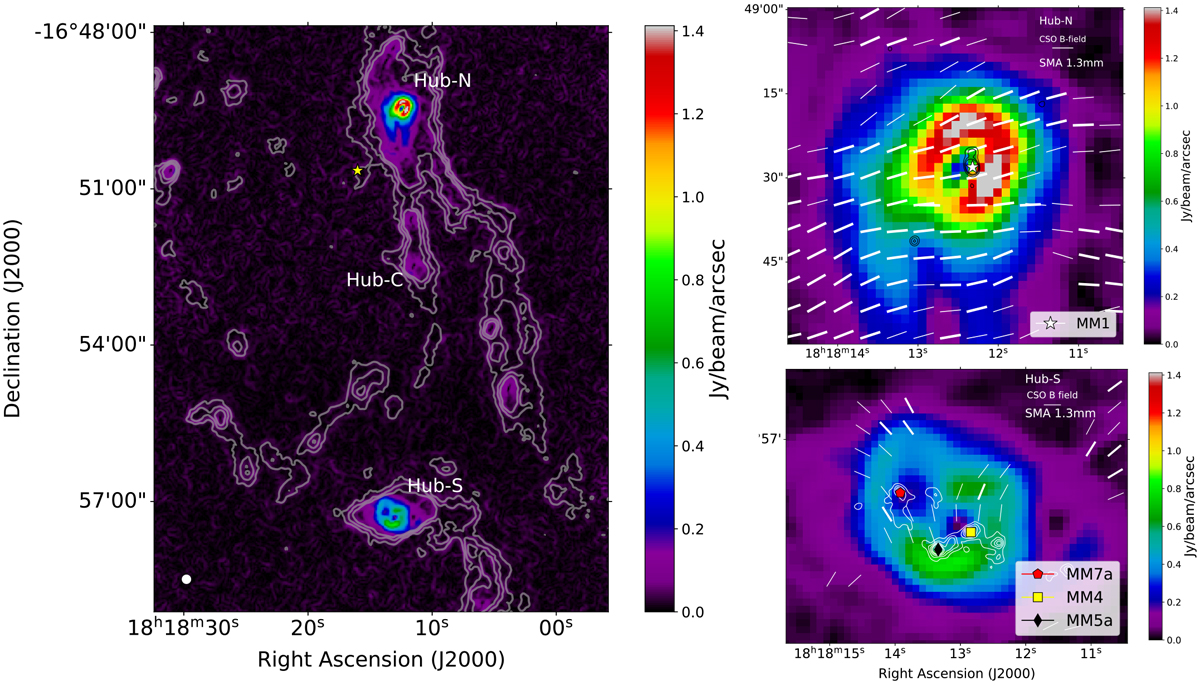
Left: CSO intensity gradient magnitudes at 350 μm in units of Jybeam−1 arcsec−1 (color scale) overlaid on the CSO dust continuum emission at 350 μm (contours, Busquet et al. 2016; Lin et al. 2017a). Contour levels are 3, 6, 9, and 12 times the rms noise of 80 mJy beam−1. The yellow star depicts the position of IRAS 18153−1651. The white circle in the bottom left corner depicts the CSO beam size (~10″). Hub-N, Hub-S, and the Hub-C candidate identified by Chen et al. (2019) are labeled. Right: close-up images of the intensity gradient toward Hub-N (top panel) and Hub-S (bottom panel) overlaid on the SMA1.3 mm dust continuum emission (black and white contours) at an angular resolution of ~ 1′′.5 (Busquet et al. 2016). Contour levels range from 12σ to 30σ in steps of 6σ, and from 30σ to 60σ in steps of 15σ, in Hub-N and similar but starting from 6σ in Hub-S, where σ is the rms of the map, ~1 mJy beam−1. White segments show the CSO B-field orientation, similar to Fig. 1. White star (right upper panel), red pentagon, black diamond, and yellow square (right bottom panel) depict MM1a, MM7a, MM4, and MM5a cores, respectively.
Current usage metrics show cumulative count of Article Views (full-text article views including HTML views, PDF and ePub downloads, according to the available data) and Abstracts Views on Vision4Press platform.
Data correspond to usage on the plateform after 2015. The current usage metrics is available 48-96 hours after online publication and is updated daily on week days.
Initial download of the metrics may take a while.