Fig. 4
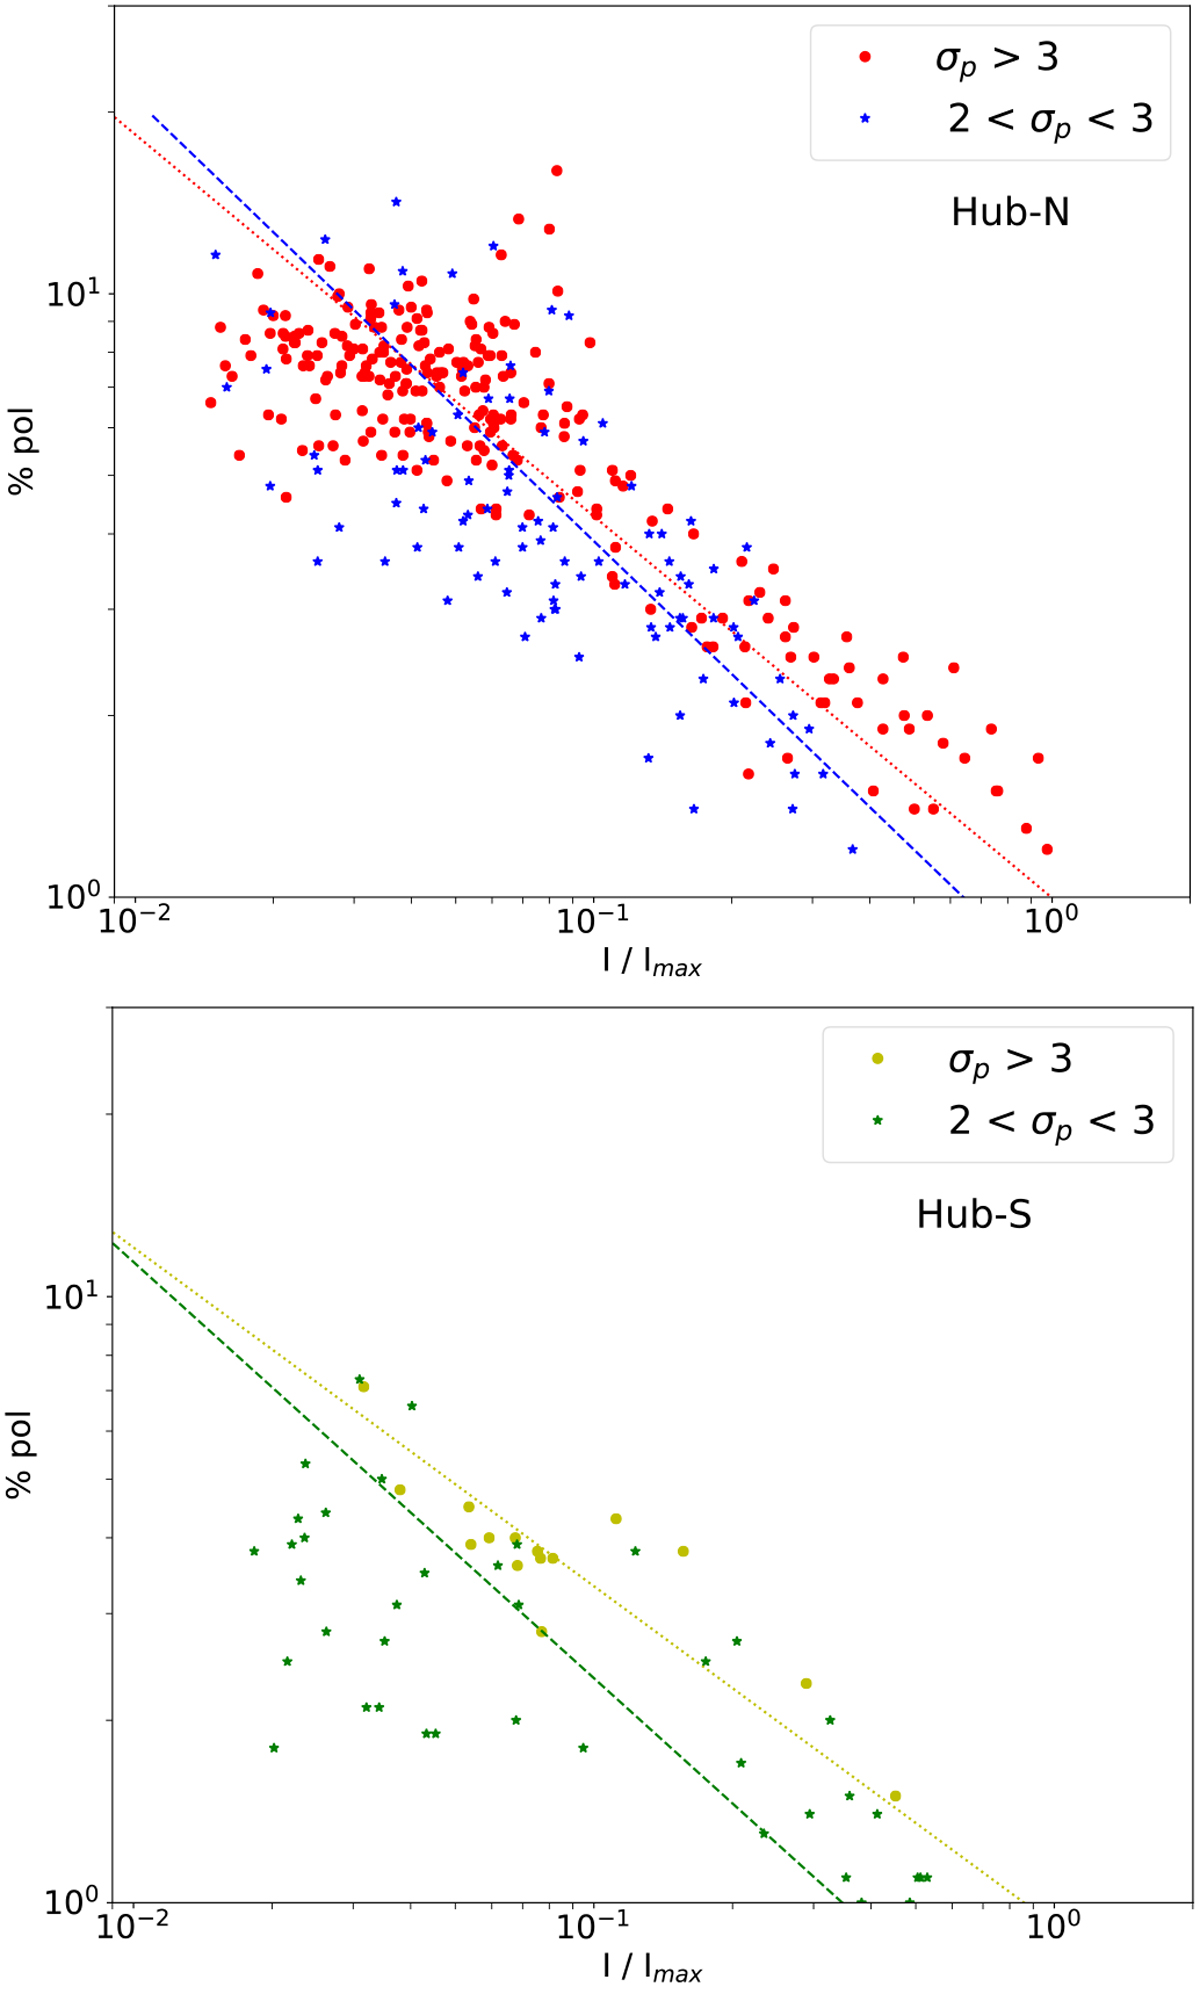
Polarization percentage as a function of the intensity normalized to the peak emission I∕Imax for Hub-N (upper panel) and Hub-S (lower panel), computed pixel by pixel. Red and Yellow circles show data > 3σP whereas blueand green stars show data between 2 and 3σP for Hub-N and Hub-S. Red and yellow dotted lines and blue and green dashed lines show the power laws that best fit the data above 3σP and the combined data, respectively (see Table 1). A lower intensity threshold of 3σ (σ = 0.08 Jy beam−1) has been considered.
Current usage metrics show cumulative count of Article Views (full-text article views including HTML views, PDF and ePub downloads, according to the available data) and Abstracts Views on Vision4Press platform.
Data correspond to usage on the plateform after 2015. The current usage metrics is available 48-96 hours after online publication and is updated daily on week days.
Initial download of the metrics may take a while.