Fig. 2
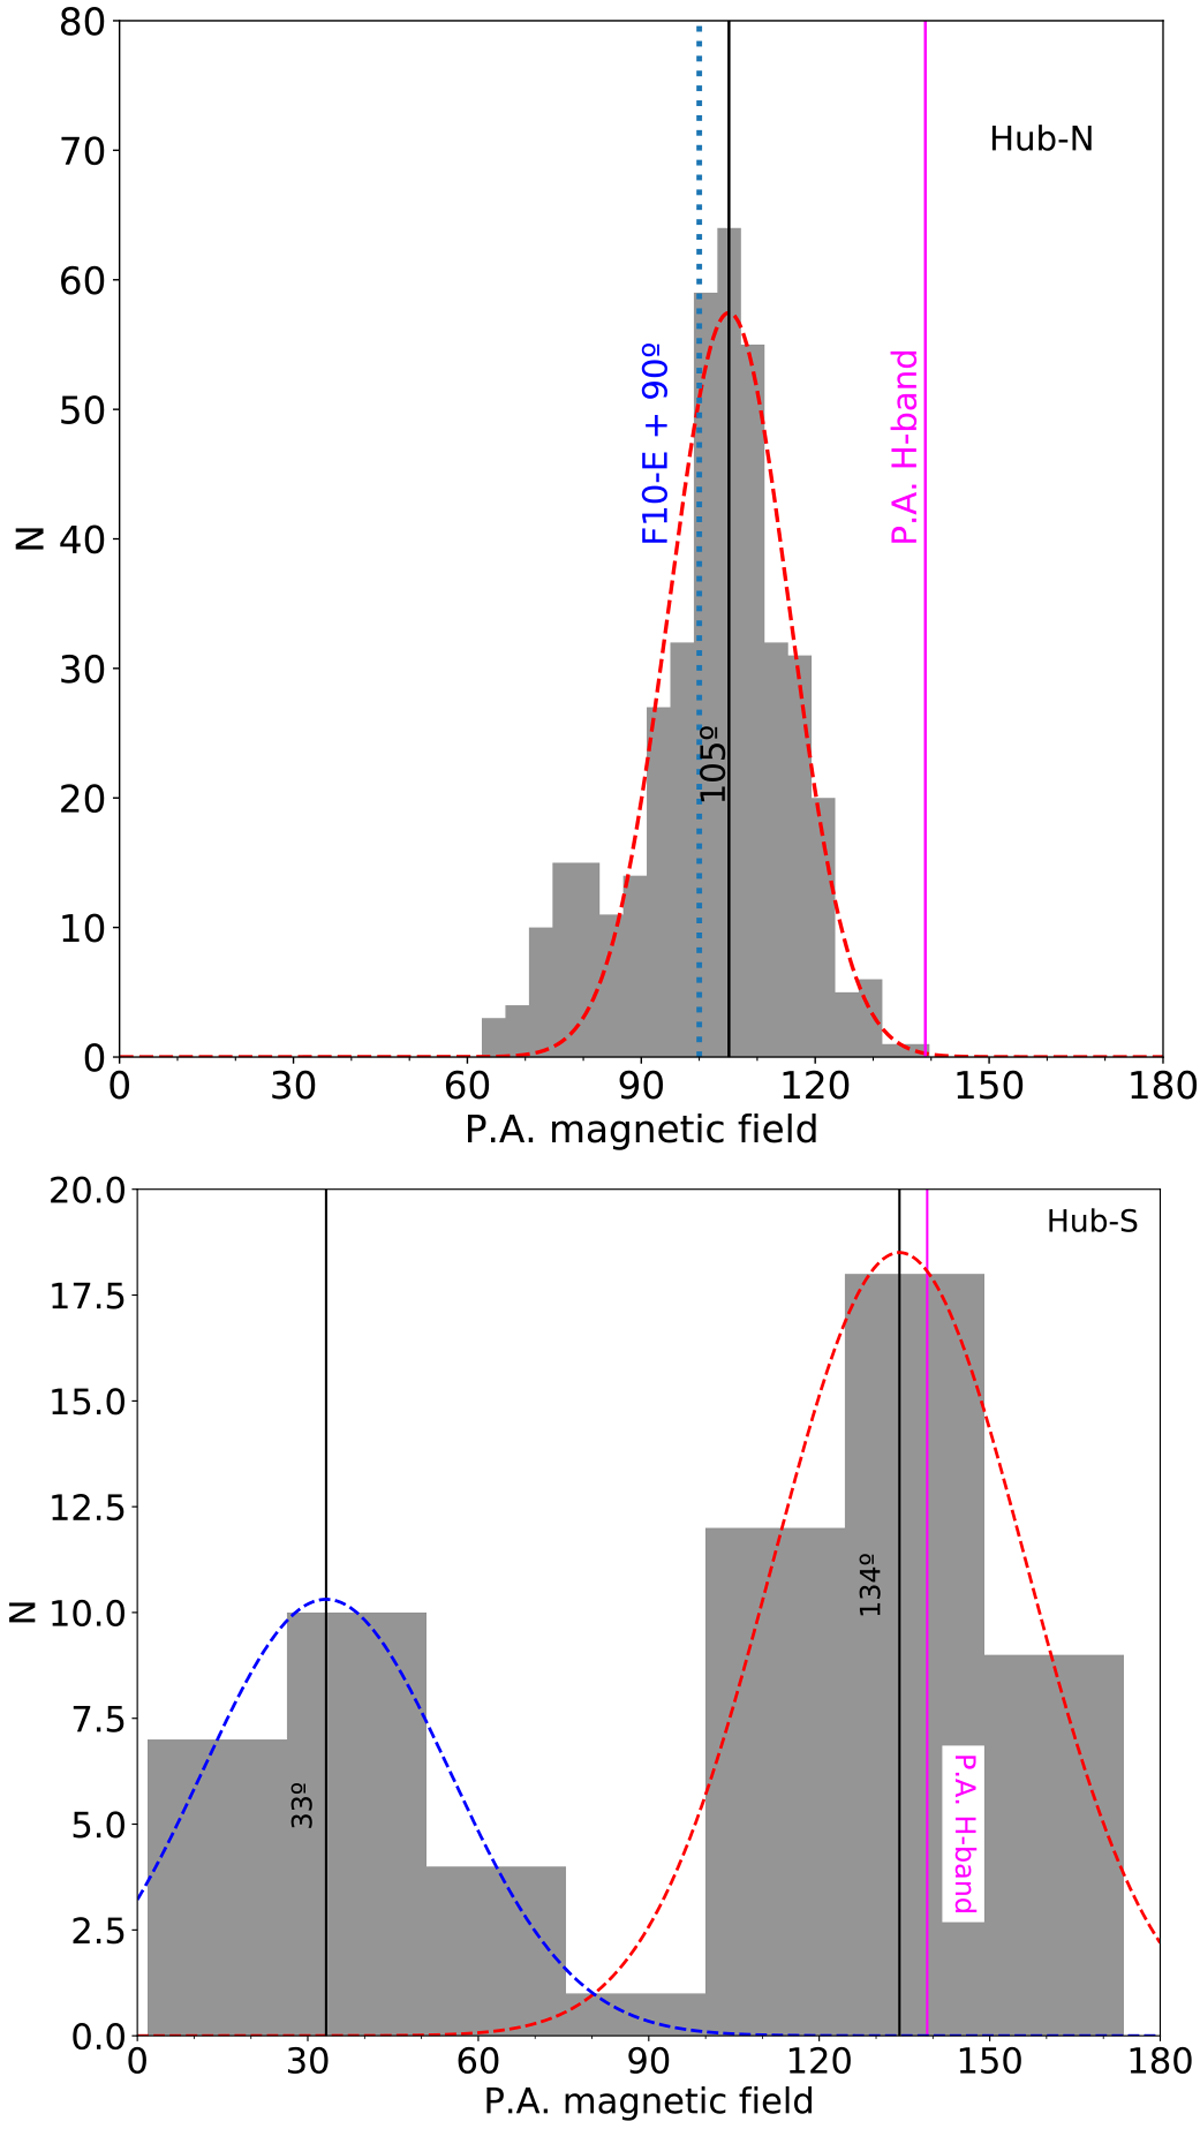
Histogram of the B-field position angles for Hub-N (top) and Hub-S (bottom). Distribution peaks at 105 ± 12° in Hub-N and 33 ± 25°/134 ± 26° in Hub-S, were obtained by a Gaussian fit. The direction perpendicular to the main filament (i.e., F10-E, ~ 100°, Busquet et al. 2013)is indicated by the dotted blue vertical line. The magenta solid line indicates the overall orientation of the polarization in the H-band (Santos et al. 2016).
Current usage metrics show cumulative count of Article Views (full-text article views including HTML views, PDF and ePub downloads, according to the available data) and Abstracts Views on Vision4Press platform.
Data correspond to usage on the plateform after 2015. The current usage metrics is available 48-96 hours after online publication and is updated daily on week days.
Initial download of the metrics may take a while.