Fig. 1
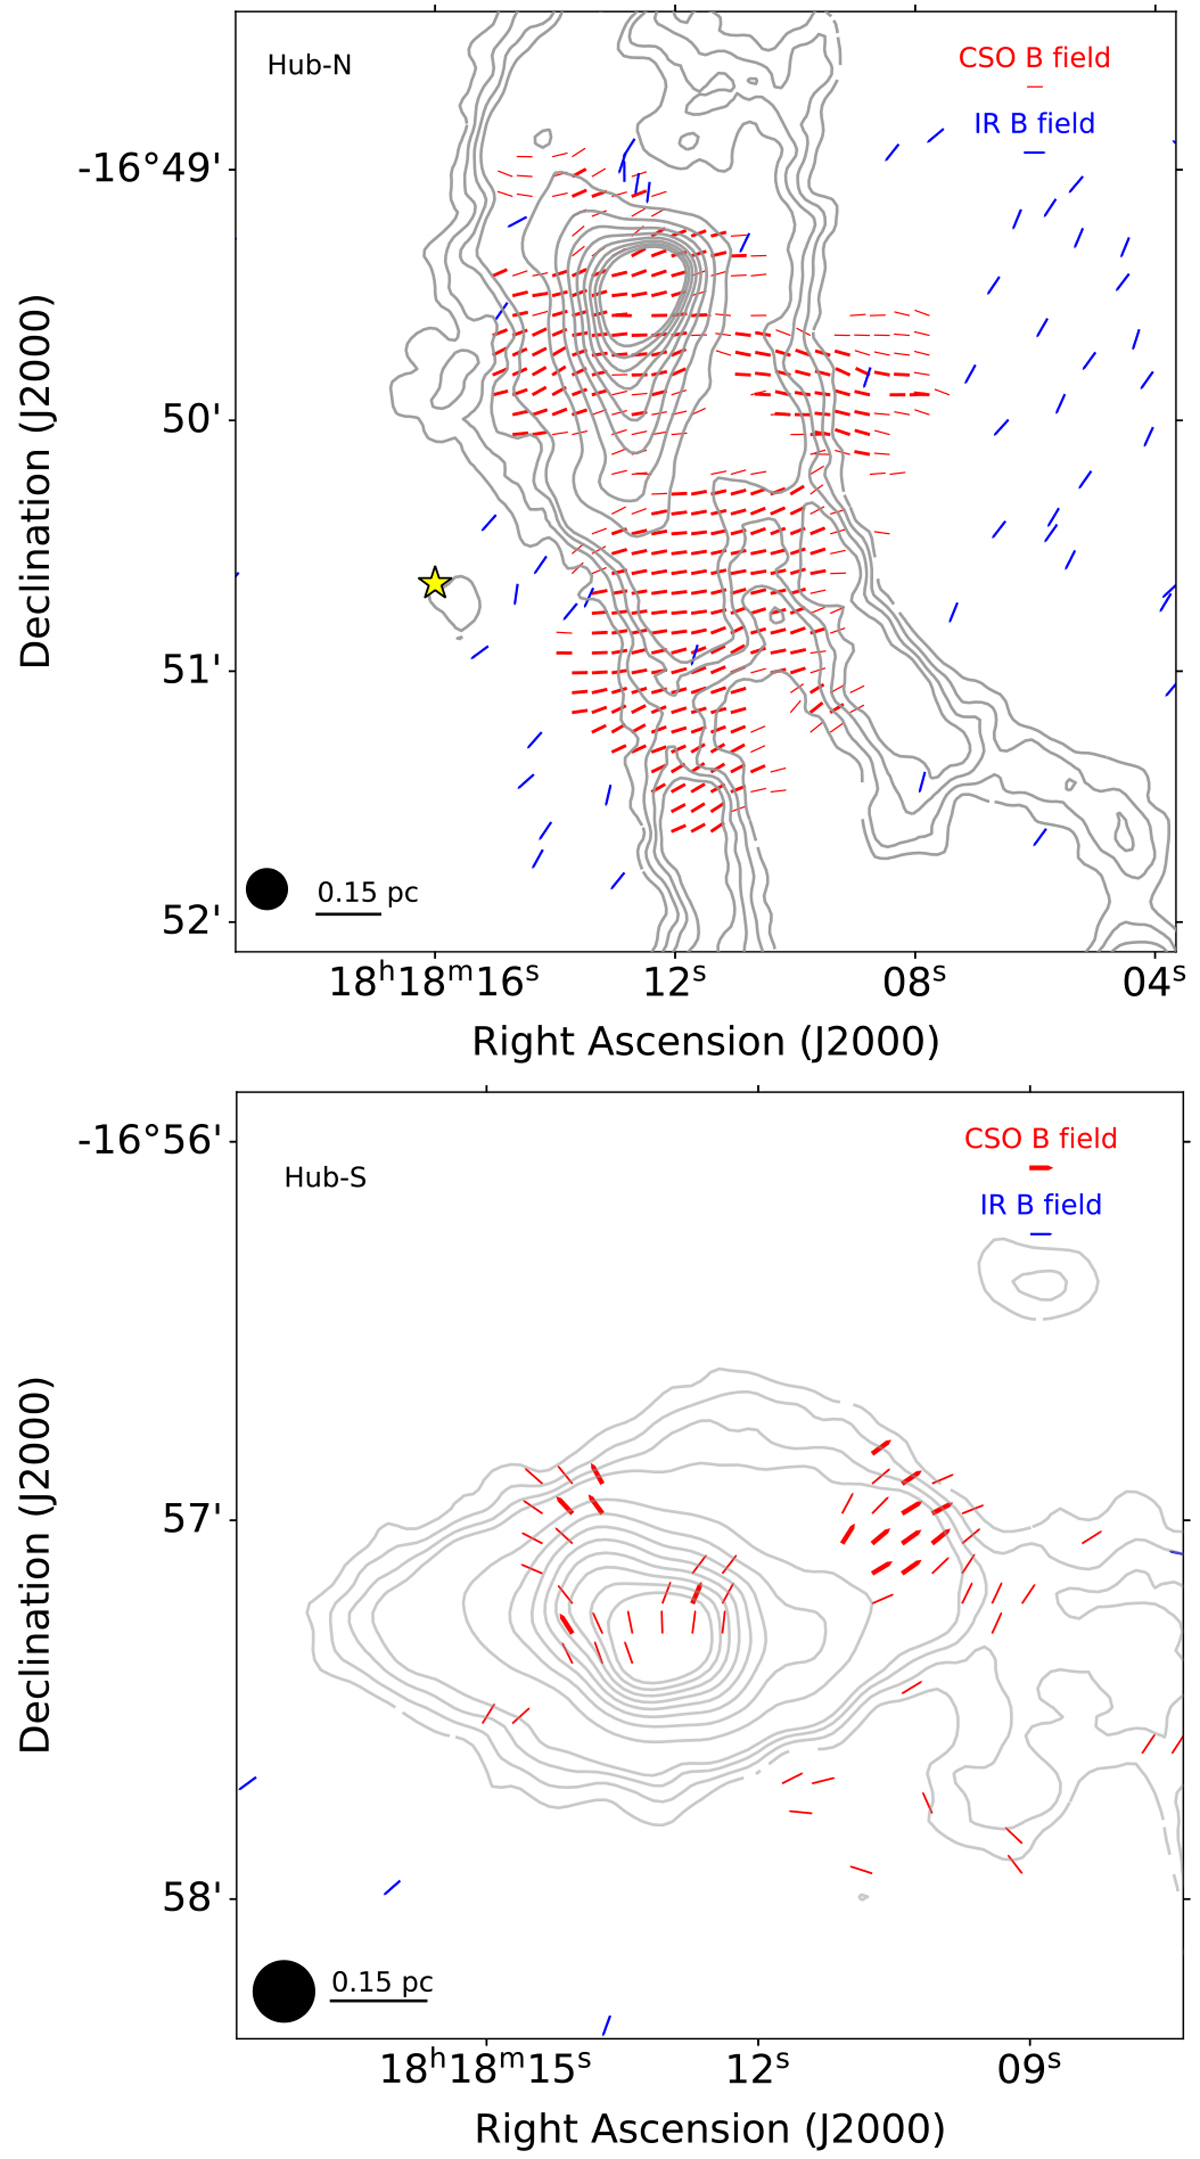
Polarization data toward Hub-N (top panel) and Hub-S (bottom panel) of the IRDC G14.2. Red segments depict the magnetic field (Nyquist sample) observed with the CSO at 350 μm obtained by rotating polarization vectors by 90°. The width illustrates segments above 3σp (thick segments) and between 2σp and 3σp (thin segments). Only segments over 15%/25% in Hub-N/Hub-S of Stokes I peak intensity are shown. Blue segments depict the magnetic field obtained from near-infrared (H-band) observations (Santos et al. 2016). Contours show the CSO 350 μm dust continuum emission (Busquet et al. 2016; Lin et al. 2017a,b). Contour levels are 2, 4, 6, 8, 10, 20, 30, 40, 50, 60, 70, 80, 90 and 100 times the rms noise (~ 80 mJy beam−1). The CSO beam (~10″) is shown in the bottom left corner of each panel. The yellow star (top panel) depicts the position of IRAS 18153-1651.
Current usage metrics show cumulative count of Article Views (full-text article views including HTML views, PDF and ePub downloads, according to the available data) and Abstracts Views on Vision4Press platform.
Data correspond to usage on the plateform after 2015. The current usage metrics is available 48-96 hours after online publication and is updated daily on week days.
Initial download of the metrics may take a while.