Fig. 8.
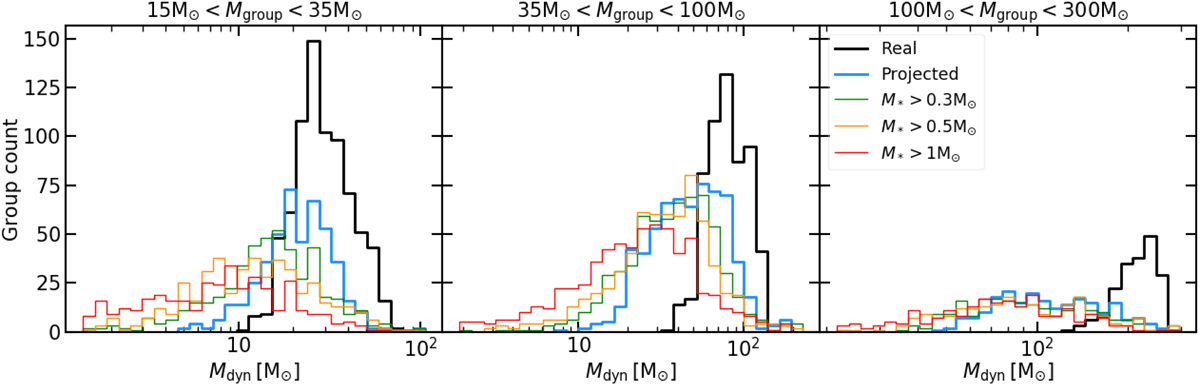
Comparison of the dynamical mass estimated on projected groups with different levels of incompleteness. The three panels correspond to the different real mass bins chosen in Fig. 7. The black histogram is the reference set of real groups and the blue histogram is the set of complete projected groups. The histograms in green, orange and red represents projected groups that are only complete down to 0.3 M⊙, 0.5 M⊙ and 1 M⊙ respectively. The figure shows the results using the 90% Lagrangian radii.
Current usage metrics show cumulative count of Article Views (full-text article views including HTML views, PDF and ePub downloads, according to the available data) and Abstracts Views on Vision4Press platform.
Data correspond to usage on the plateform after 2015. The current usage metrics is available 48-96 hours after online publication and is updated daily on week days.
Initial download of the metrics may take a while.