Fig. 7.
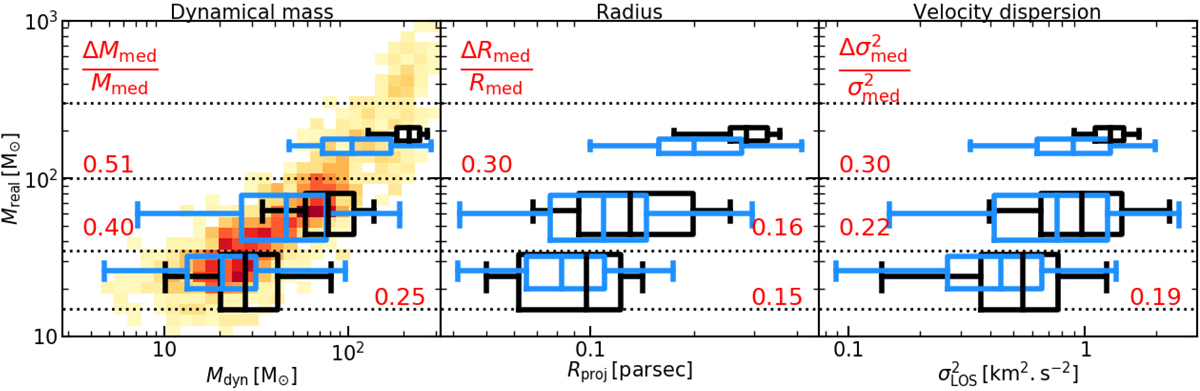
Comparison between projected and real group properties for three mass bins: [15; 35] M⊙, [35; 100] M⊙ and [100; 300] M⊙ (dashed lines). Distributions of each estimate are represented as black box plots for real groups and blue ones for projected groups. The relative error on the median for each distribution is annotated in red. In each box plot, the vertical middle tick represents the median of the distribution, the edges show the 16th and 84th percentiles, and the whiskers correspond to the full extension of the distribution. The estimates plotted correspond to the 90% Lagrangian radii but other radii give similar trends. The height of the boxes is proportional to the number of groups inside each mass bin. The 2D histogram of Fig. 6 is over-plotted on the panel of the dynamical mass estimate.
Current usage metrics show cumulative count of Article Views (full-text article views including HTML views, PDF and ePub downloads, according to the available data) and Abstracts Views on Vision4Press platform.
Data correspond to usage on the plateform after 2015. The current usage metrics is available 48-96 hours after online publication and is updated daily on week days.
Initial download of the metrics may take a while.