Fig. 5.
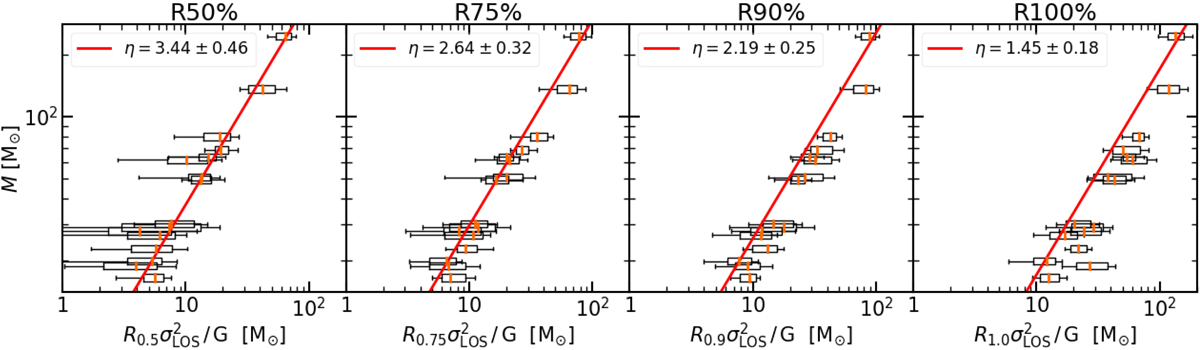
Correlation between the true and dynamical mass of real groups. Each panel shows different chosen radii for the dynamical mass estimate. All possible values along different projecting angles for the same group are shown in a box-plot: the orange vertical tick marks represents the median of the distribution; the edge of the box, the 16th and 84th percentiles (such that 68% of the data are inside the box), and the horizontal bars correspond to the total width of the full distribution. The red lines are the least square fits on the data giving the values of η corresponding to each radius.
Current usage metrics show cumulative count of Article Views (full-text article views including HTML views, PDF and ePub downloads, according to the available data) and Abstracts Views on Vision4Press platform.
Data correspond to usage on the plateform after 2015. The current usage metrics is available 48-96 hours after online publication and is updated daily on week days.
Initial download of the metrics may take a while.