Open Access
Fig. 2.
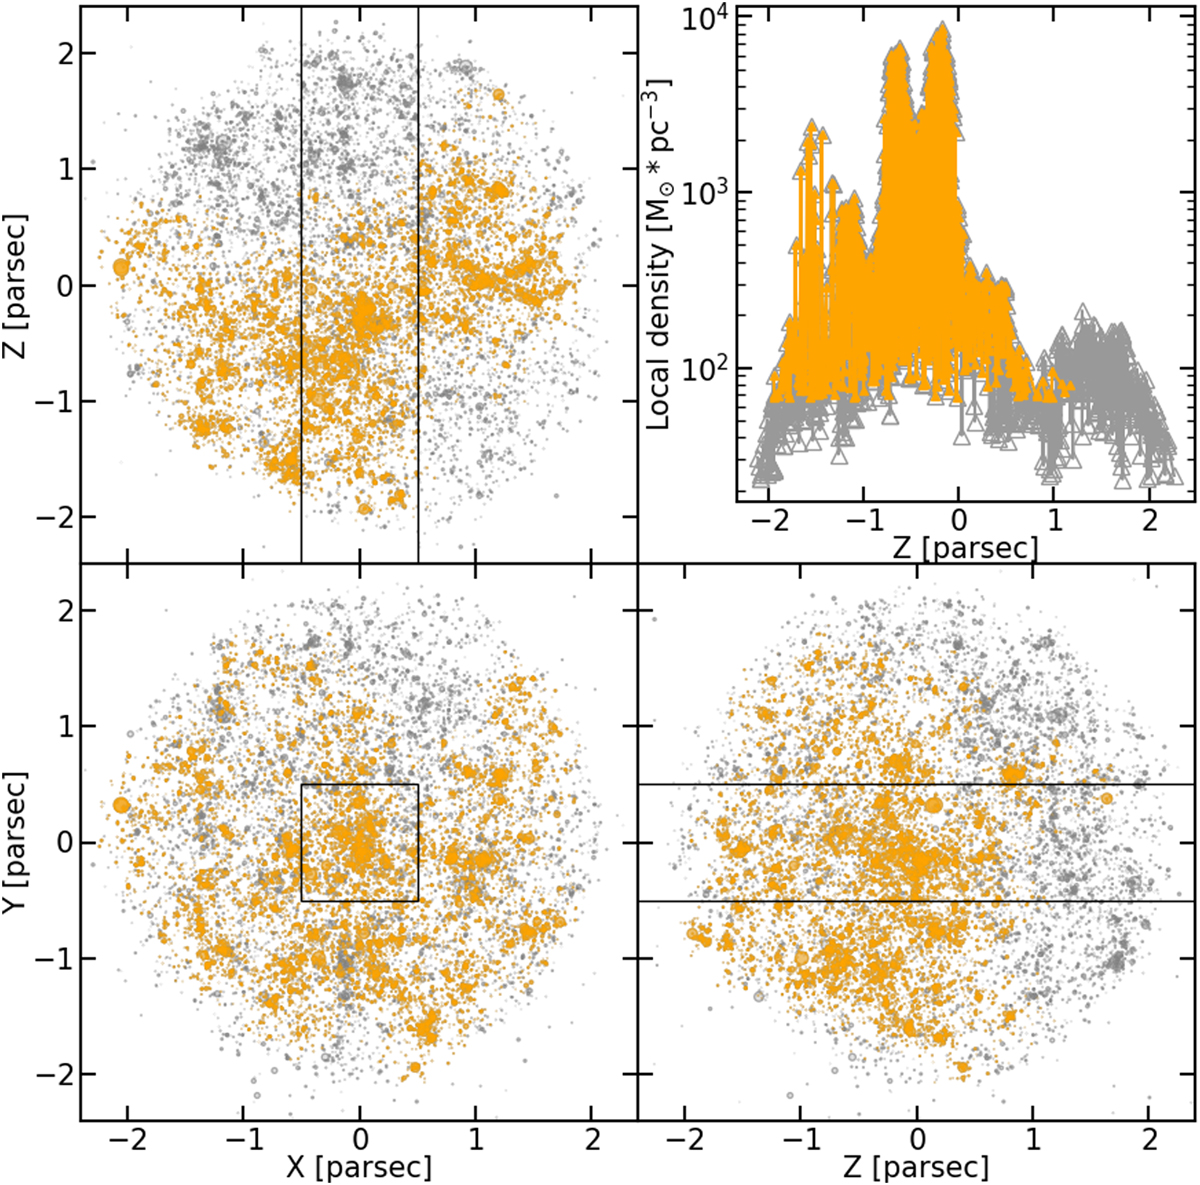
Three orthogonal views of the GDF model. The full initial sample of stars is represented in grey shades and the sub-sample we extracted is shown in orange. Upper right panel: local density of the particles estimated by HOP stacked along the slice represented by the black rectangles on the three other views.
Current usage metrics show cumulative count of Article Views (full-text article views including HTML views, PDF and ePub downloads, according to the available data) and Abstracts Views on Vision4Press platform.
Data correspond to usage on the plateform after 2015. The current usage metrics is available 48-96 hours after online publication and is updated daily on week days.
Initial download of the metrics may take a while.