Fig. 10.
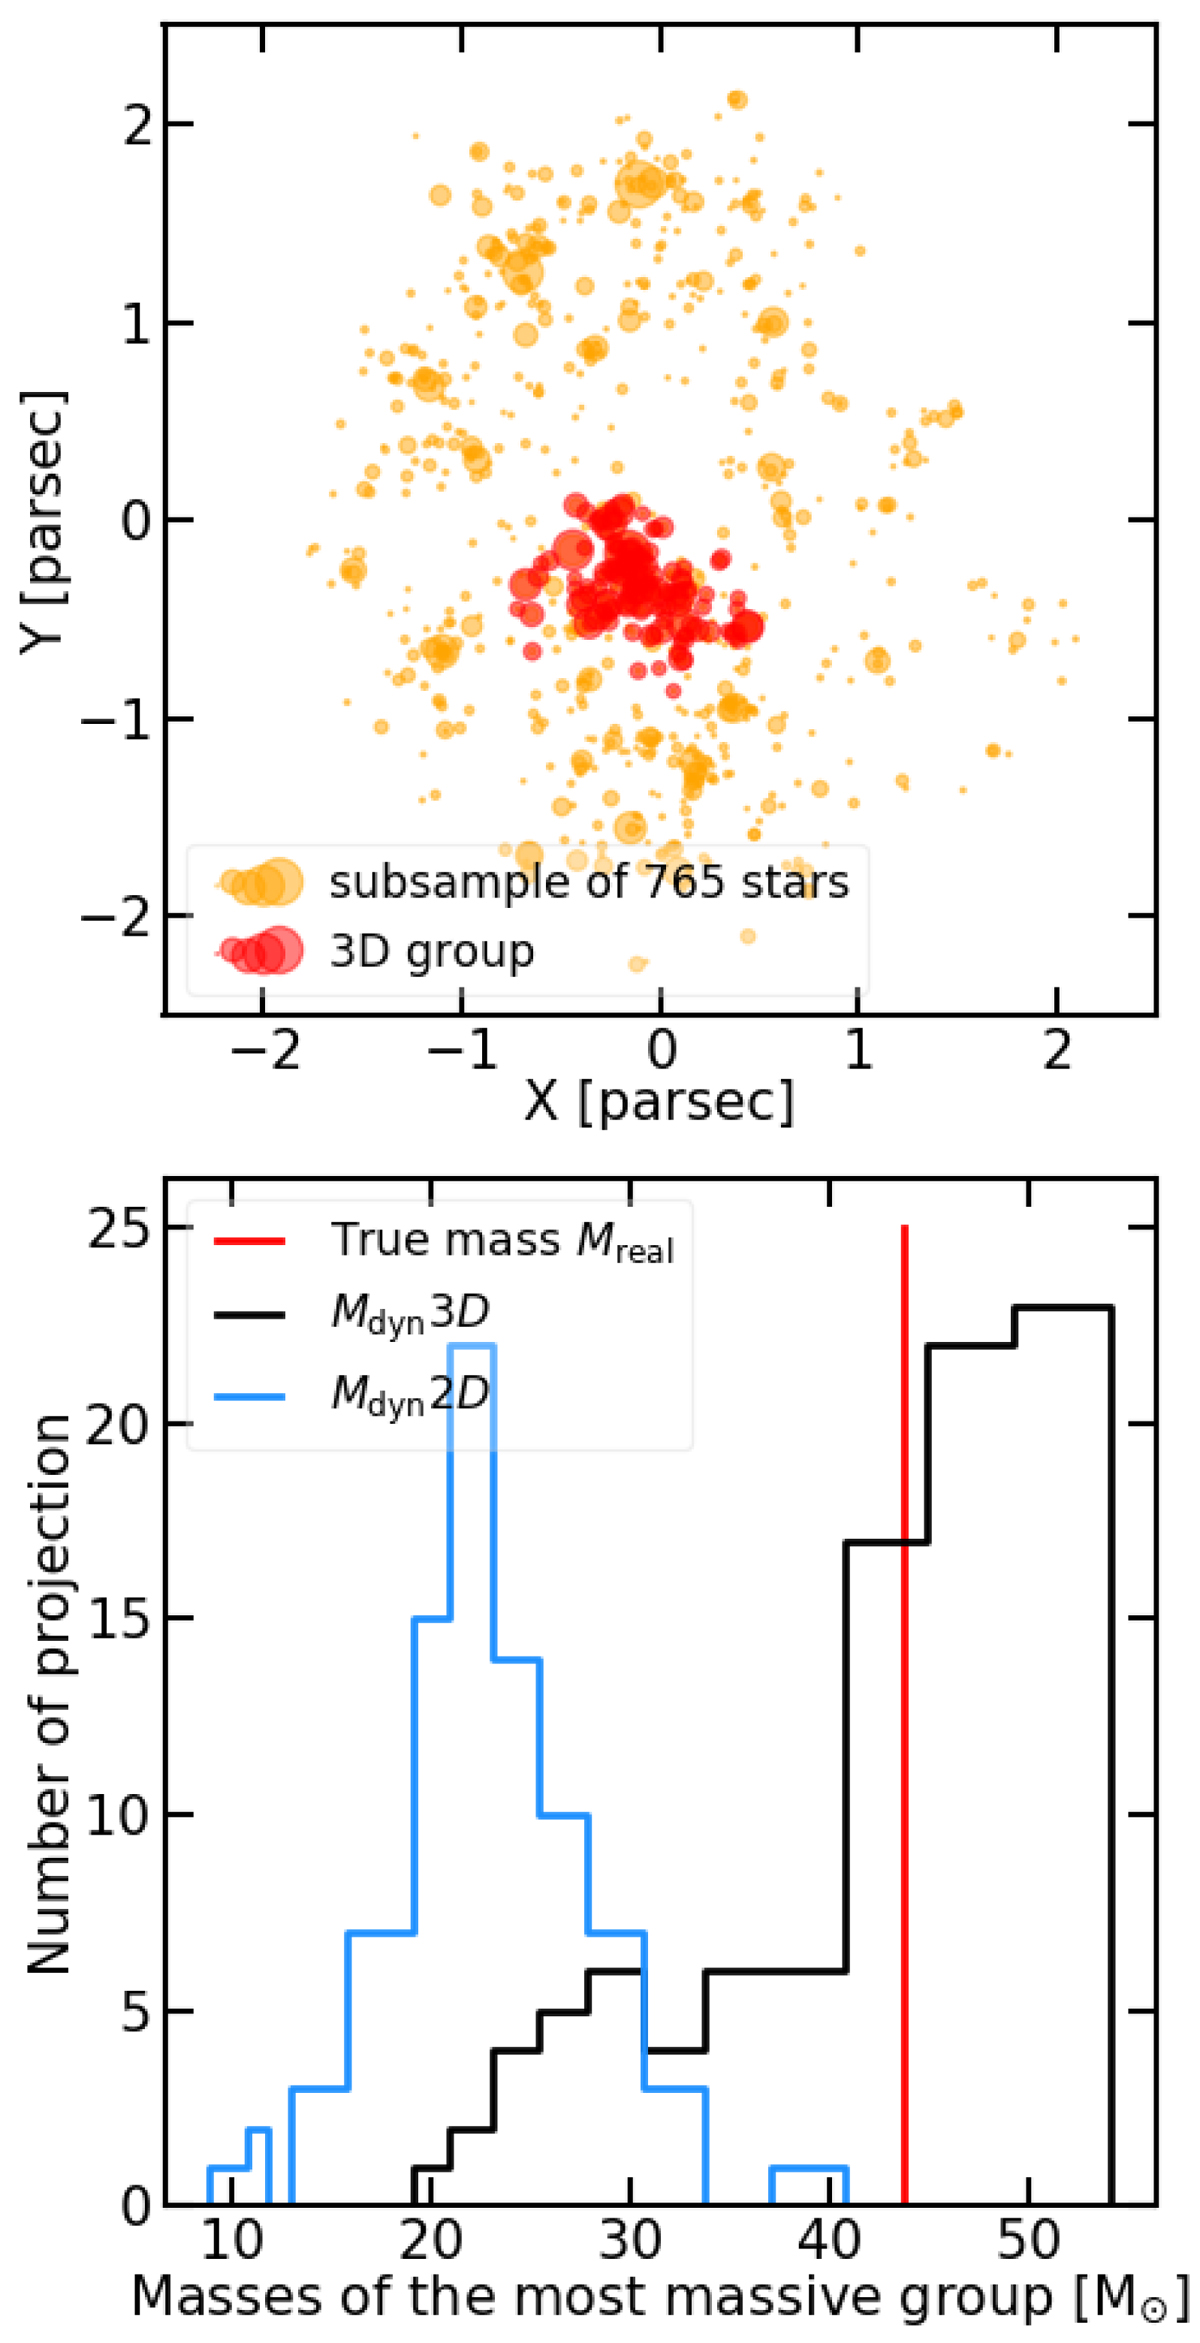
Upper panel: sub-sample extracted from a GDF model of 1000 stars with the method of Sect. 2.3. Only one major group is identified in 3D by the MST (red dots). Lower panel: distributions of the dynamical mass estimated on different projections of the main group identified by the MST in 3D (black line) and in projection (blue line). The true mass is marked as the vertical red line.
Current usage metrics show cumulative count of Article Views (full-text article views including HTML views, PDF and ePub downloads, according to the available data) and Abstracts Views on Vision4Press platform.
Data correspond to usage on the plateform after 2015. The current usage metrics is available 48-96 hours after online publication and is updated daily on week days.
Initial download of the metrics may take a while.