Fig. 8
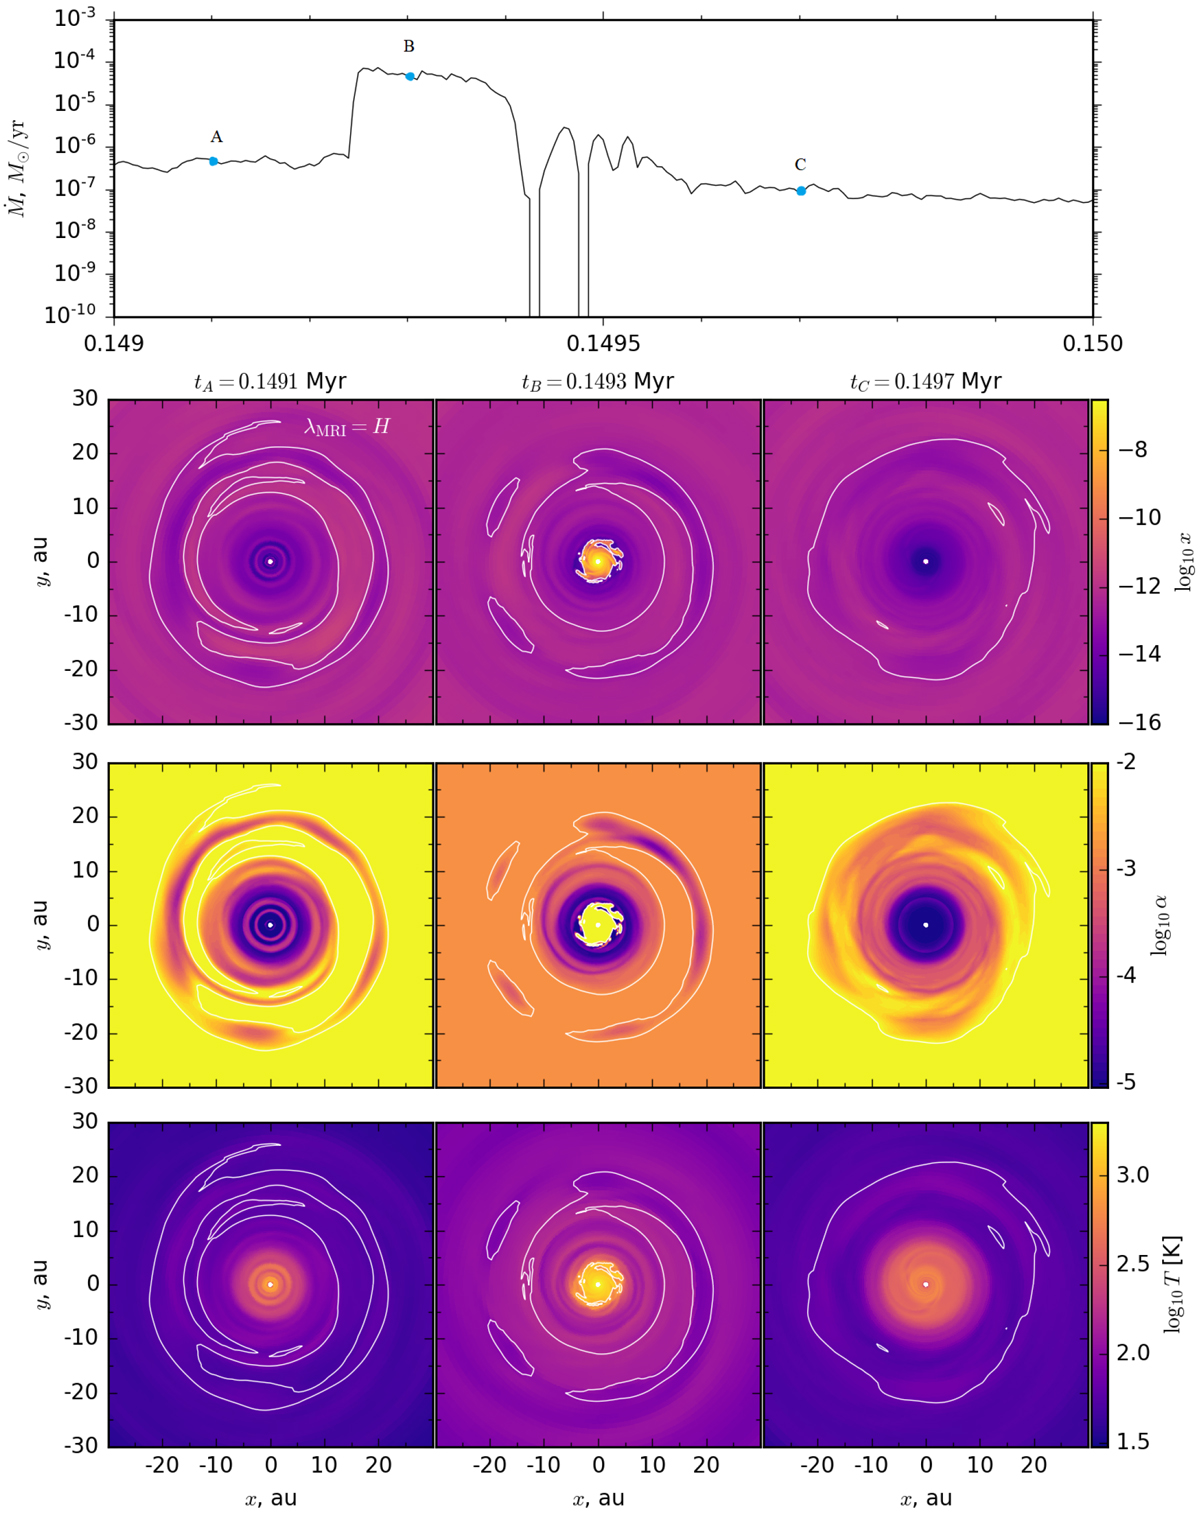
Upper panel: accretion rate onto the star versus time in the time interval t = [0.149, 0.150] Myr after the disk formation. Lower rows of panels: two-dimensional distributions of the ionization fraction (first row), turbulent parameter α (second row), and gas temperature (third row) in the region r ≤ 30 au at time instants t = 0.1491, 0.1493 and 0.1497 Myr marked with blue rounds with labels “A”, “B” and “C” in the upper panel, respectively. The white contour delineates the boundary of the dead zone.
Current usage metrics show cumulative count of Article Views (full-text article views including HTML views, PDF and ePub downloads, according to the available data) and Abstracts Views on Vision4Press platform.
Data correspond to usage on the plateform after 2015. The current usage metrics is available 48-96 hours after online publication and is updated daily on week days.
Initial download of the metrics may take a while.