Fig. 7
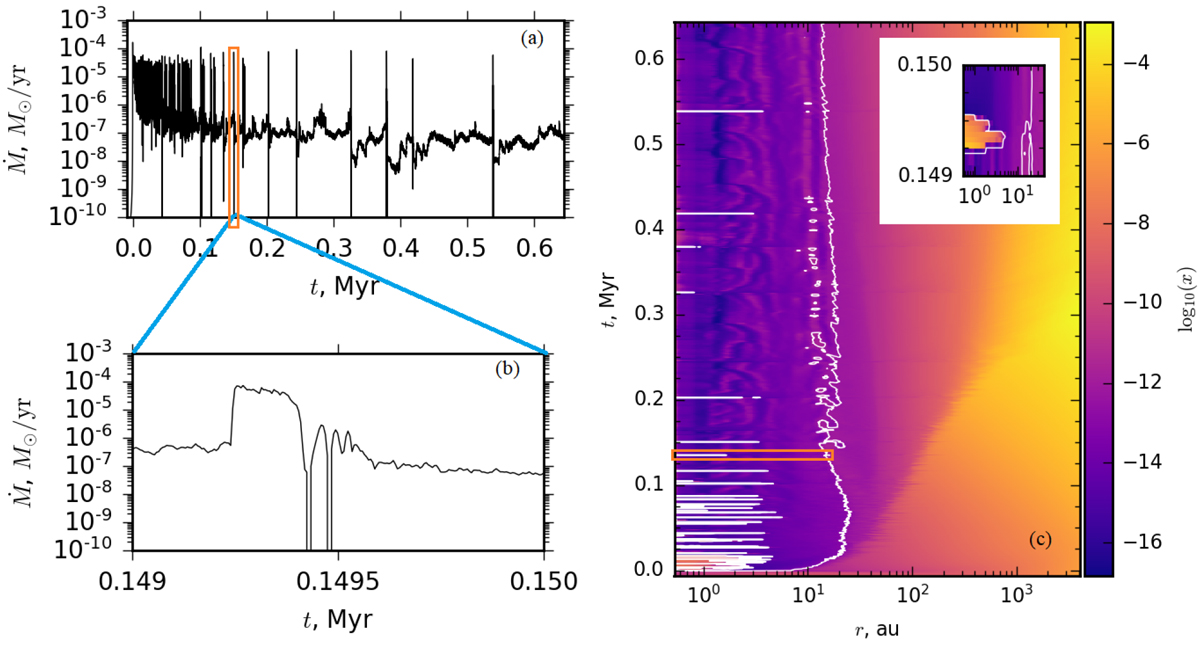
Top left (a): the accretion rate onto the star versus time starting from disk formation. Bottom left (b): similar to the top-left panel, but for a time interval t = [0.149, 0.150] Myr. Orange rectangles mark the burst analyzed in Fig. 8. Right (c): space–time diagram of the azimuthally averaged ionization fraction. The white contour line delineates the dead zone boundary. The time is counted from the instance of disk formation.
Current usage metrics show cumulative count of Article Views (full-text article views including HTML views, PDF and ePub downloads, according to the available data) and Abstracts Views on Vision4Press platform.
Data correspond to usage on the plateform after 2015. The current usage metrics is available 48-96 hours after online publication and is updated daily on week days.
Initial download of the metrics may take a while.