Free Access
Fig. 3
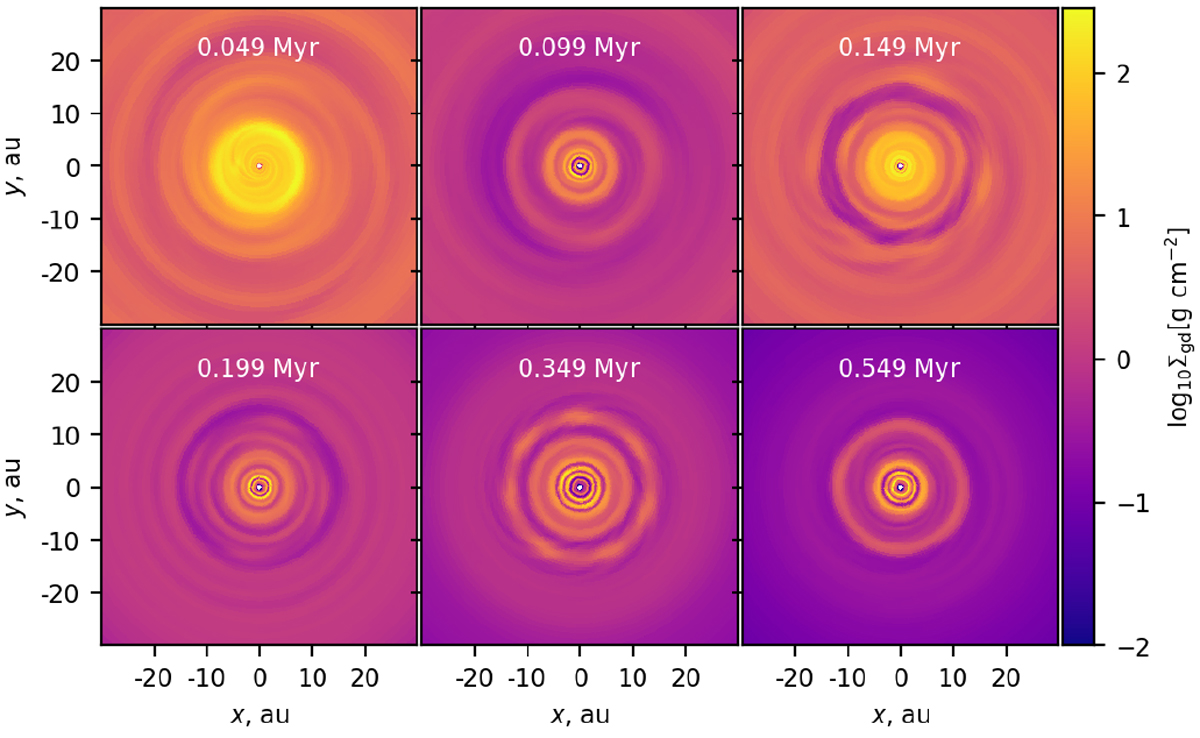
Two-dimensional distribution of the grown dust surface density in the inner 6 × 60 au2 box at time instances 0.049, 0.099, 0.149, 0.199, 0.349, 0.549 Myr after disk formation. The time is counted from the disk formation instance.
Current usage metrics show cumulative count of Article Views (full-text article views including HTML views, PDF and ePub downloads, according to the available data) and Abstracts Views on Vision4Press platform.
Data correspond to usage on the plateform after 2015. The current usage metrics is available 48-96 hours after online publication and is updated daily on week days.
Initial download of the metrics may take a while.