Fig. 4
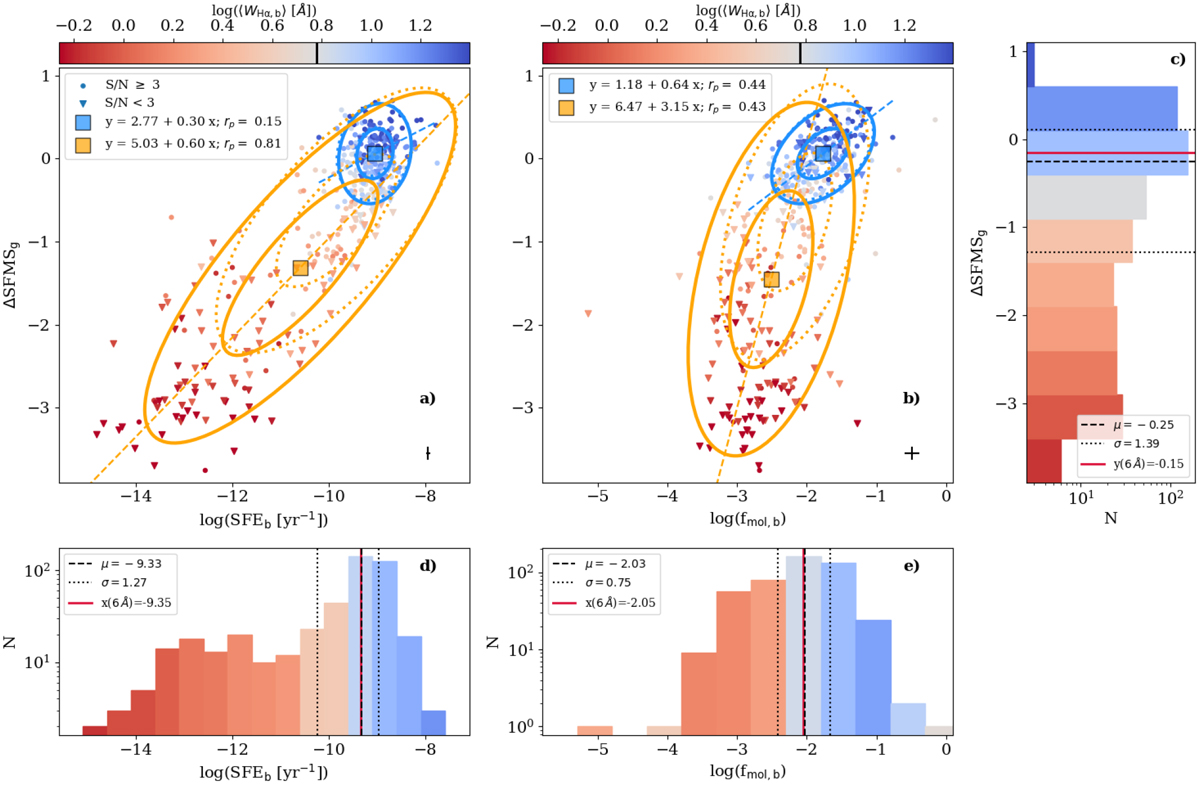
Offset from main sequence for a galaxy (ΔSFMSg) versus star formation efficiency (SFEb, panel a) and versus the molecular gas fraction inside the APEX beam (fmol, b, panel b) colour-coded by the median Hα equivalent width (⟨WHα,b⟩) within the APEX beam aperture. In the two panels, circles represent CO detections (S∕N ≥ 3), while triangles indicate CO upper limits (S∕N < 3). Error bars at the bottom right of each figure represent the typical uncertainties of the represented parameters. The two sub-samples include galaxies largely retired in the centre (⟨WH α,b⟩ < 6Å), or dominated by star formation (⟨WHα,b⟩ > 6Å), following the results of Fig. 3. The squares represent the median values of the represented parameters for the two sub-samples, while the ellipses correspond to the shape of the distribution derived using the PCA analysis described in the text, and contain approximately 1 and 2σ of the data within the two sub-samples. Dotted-line ellipses are obtained including only CO detections, while solid-line ellipses correspond to the full sample (which also includes CO upper limits). Due to the different dynamical range of the x- and y-axes, some ellipses could be distorted, therefore the dashed coloured lines clarify the principalcomponent direction for the full sub-samples. In the legend, the formulae indicate the linear fits derived from the two sub-samples using the PCA analysis and rp, the respective Pearson correlation coefficients. Panels c–e: histogram distributions of ΔSFMSg, SFEb, and fmol,b, respectively colour-encoded by the average ⟨WHα,b⟩ in each bin. The dashed line indicates the median of the distribution (μ), while the dotted lines the interquartile range (σ). The red line indicates the value of the quantity at the demarcation value given by ⟨WH α,b⟩ = 6 Å (i.e. the separation between centrally star-forming and retired galaxies). The black vertical line in the colour bars of panels a and b indicates the demarcation ⟨WH α,b⟩ = 6 Å value in logarithmic units.
Current usage metrics show cumulative count of Article Views (full-text article views including HTML views, PDF and ePub downloads, according to the available data) and Abstracts Views on Vision4Press platform.
Data correspond to usage on the plateform after 2015. The current usage metrics is available 48-96 hours after online publication and is updated daily on week days.
Initial download of the metrics may take a while.