Fig. 3
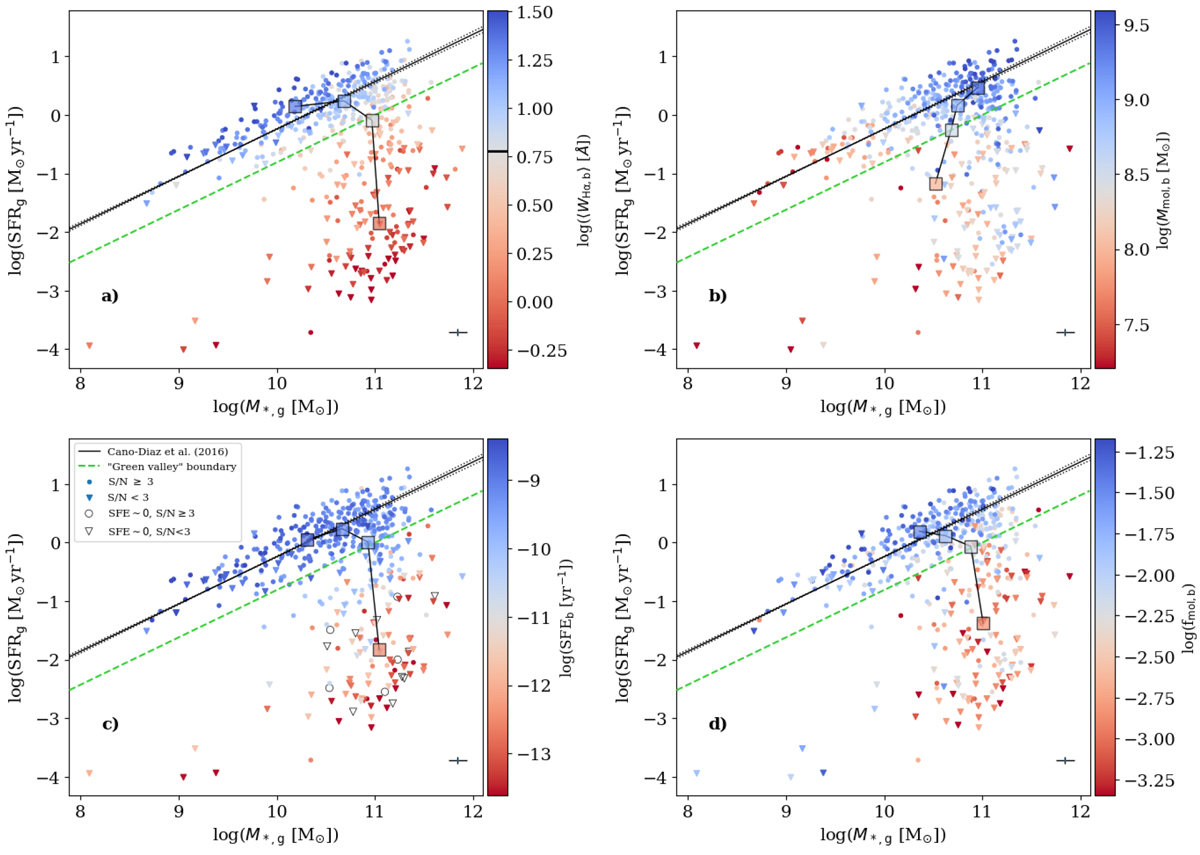
SFR-M* diagrams integrated over CALIFA FoV, colour-coded by the median of the following quantities calculated in the APEX beam as described in the text: (a) median Hα equivalent width (⟨WHα,b⟩); (b) molecular gas mass (Mmol, b); (c) star formation efficiency (SFEb); and (d) fraction of molecular gas with respect to the stellar mass (fmol, b). The solid black line indicates the SFMS fit by Cano-Díaz et al. (2016) with its confidence level (dotted lines). The green dashed line is 3σ (0.6 dex) below the SFMS fit, which we assume indicates the start of the “green valley”. In each panel, circles indicate CO detections (S∕N ≥ 3), and triangles non-detections (S∕N < 3). Panel c: unfilled symbols show data with SFE~0 (i.e. SFR~0) within the APEX beam aperture (see text for further details). The squares illustrate the position of the average M* and SFR at four different percentile ranges of the colouring parameter (<25%, 25–50%, 50–75% and >75%), with their colours indicating the average value at each percentile range. The error bar in the bottom right of each panel shows the average errors of the reported parameters. The black horizontal line in the colour bar of panel a indicates the demarcation ⟨WH α,b⟩ = 6 Å value in logarithmic units.
Current usage metrics show cumulative count of Article Views (full-text article views including HTML views, PDF and ePub downloads, according to the available data) and Abstracts Views on Vision4Press platform.
Data correspond to usage on the plateform after 2015. The current usage metrics is available 48-96 hours after online publication and is updated daily on week days.
Initial download of the metrics may take a while.