Fig. 2
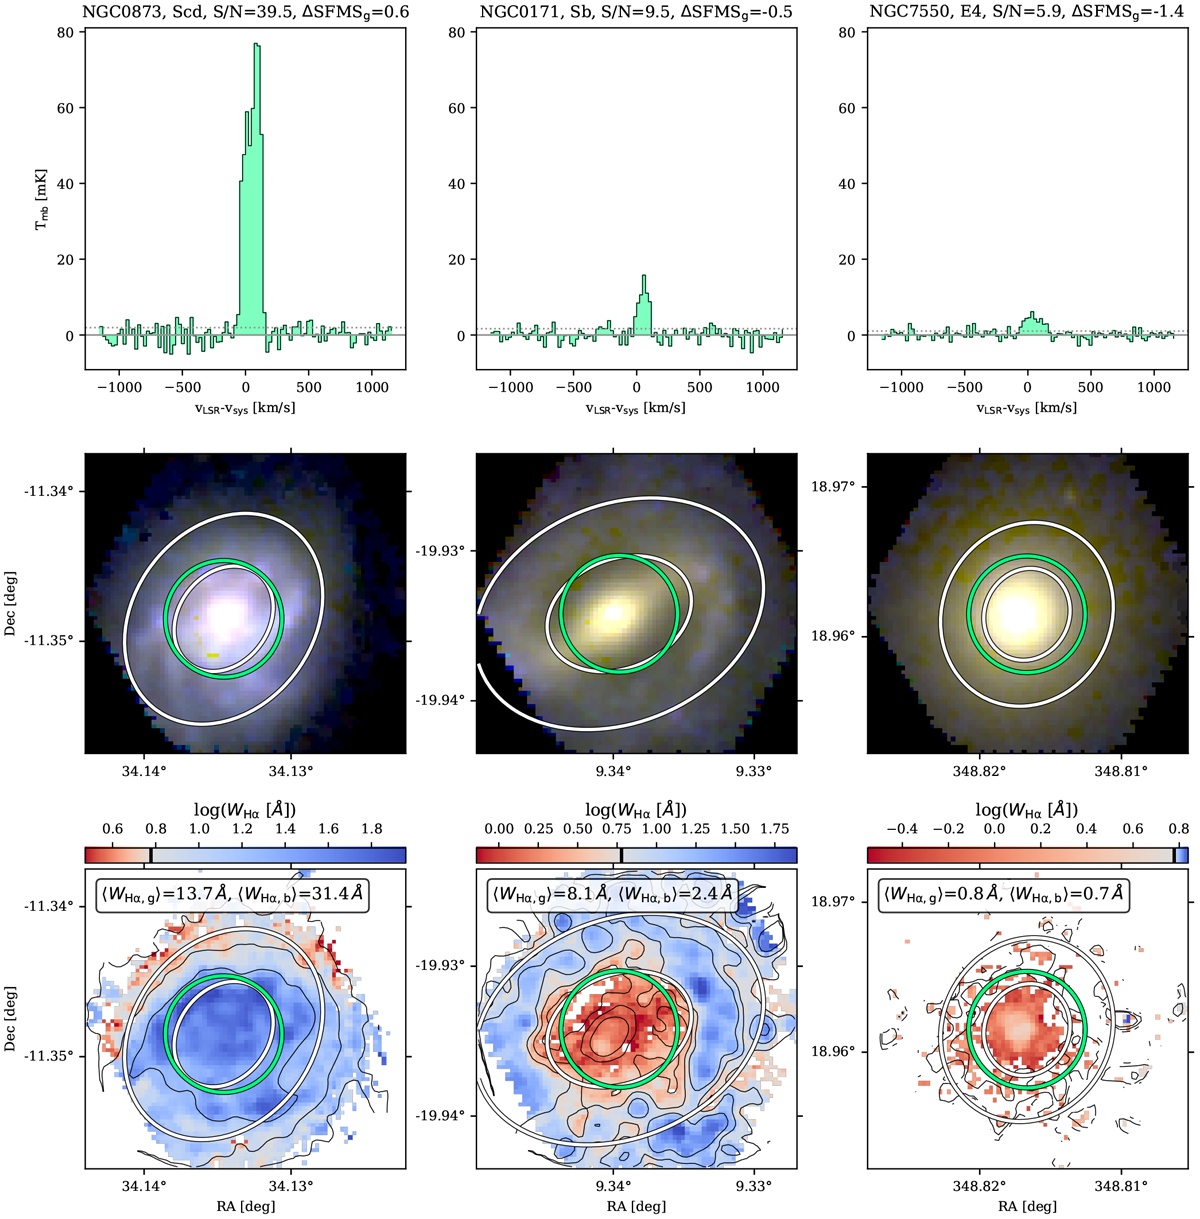
APEX 12CO(2–1) spectra of three observed galaxies in different quenching phases. Top row panels: spectra for each galaxy in green, where the dotted line represents the observation σRMS. Top row panel: titles, the name of the galaxy (as in the CALIFA database) and its morphology, CO signal-to-noise ratio (S/N), and the logarithmic ratio of the galaxy global SFR to the global star formation main sequence (ΔSFMSg). Middle row panels: continuum RGB images extracted from the CALIFA data cubes using u- (blue), g- (green) and r- (red) bands. Bottom row: WHα maps are displayed in diverging red colours where WHα < 6 Å, while the diverging blue ones illustrate the part of the map where WHα > 6 Å. The colour maps are centred at WHα = 6 Å in logarithmic units, and this value is indicated as a black vertical line in the colour bars. Black contours mark the 25, 50, and 75 percentiles of the log(FHα) distribution,previously masked at 3σRMS. The WH α map is also masked below 3σRMS of the Hα flux map. In panel legends, the median Hα equivalent width across the whole map (⟨WHα,g⟩) and within the beam aperture (⟨WHα,b⟩) are presented. In the panels of the two bottom rows, the green circle shows the APEX beam (FWHM = 26.2 arcsec at 230 GHz), while white ellipsoids indicate 1 and 2 Reff.
Current usage metrics show cumulative count of Article Views (full-text article views including HTML views, PDF and ePub downloads, according to the available data) and Abstracts Views on Vision4Press platform.
Data correspond to usage on the plateform after 2015. The current usage metrics is available 48-96 hours after online publication and is updated daily on week days.
Initial download of the metrics may take a while.