Fig. 1
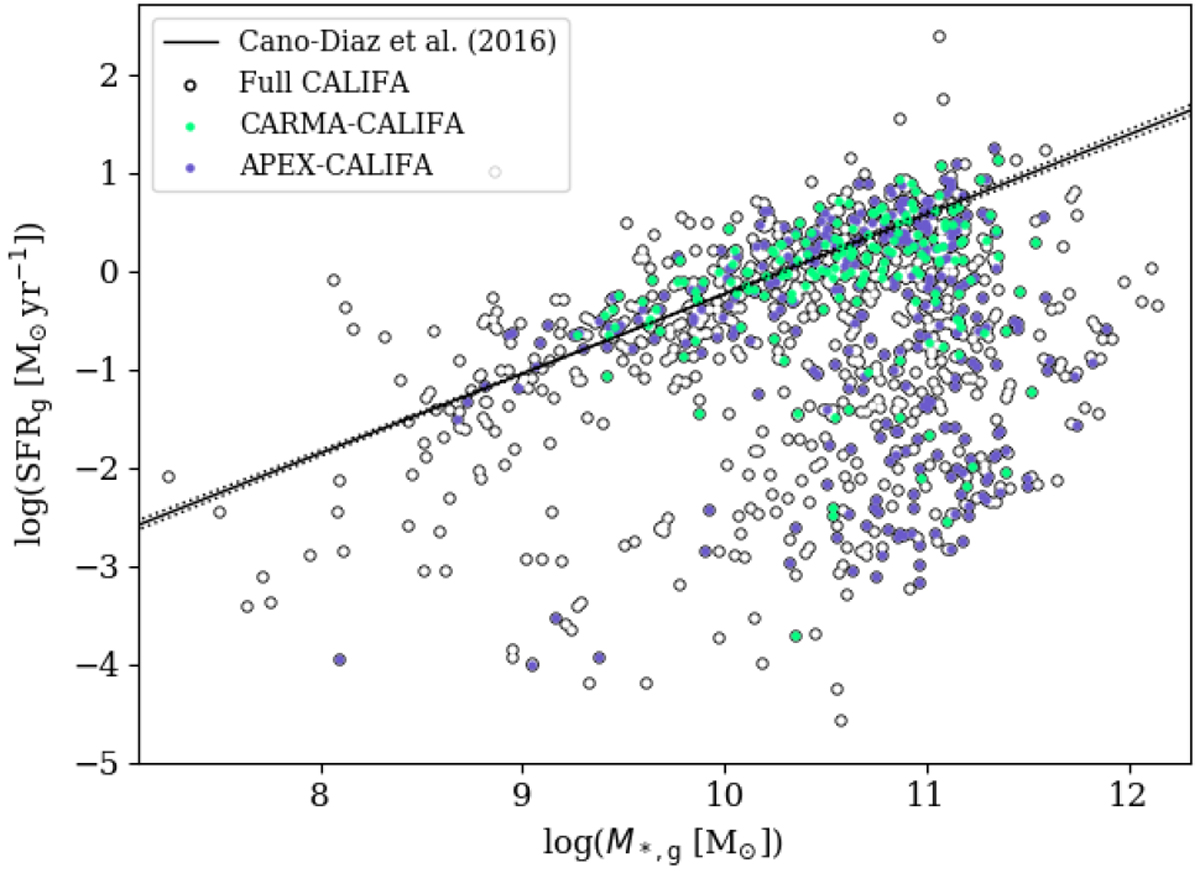
Star formation rate vs. stellar mass integrated over each galaxy, comparing the distributions of galaxies from the CARMA and APEX subsets and the remaining CALIFA galaxies. The star formation main sequence is indicated using the Cano-Díaz et al. (2016) fit (full black line) with its confidence level (dotted black lines). The diagram is zoomed-in to emphasise the CARMA and APEX coverage. The extended CALIFA sample has SFR = 10−6.2−103.3 M⊙ yr−1 and M* = 105.7−1013.7 M⊙, however only a few objects have star formation rates and stellar mass outside the range shown in the figure.
Current usage metrics show cumulative count of Article Views (full-text article views including HTML views, PDF and ePub downloads, according to the available data) and Abstracts Views on Vision4Press platform.
Data correspond to usage on the plateform after 2015. The current usage metrics is available 48-96 hours after online publication and is updated daily on week days.
Initial download of the metrics may take a while.