Fig. 7.
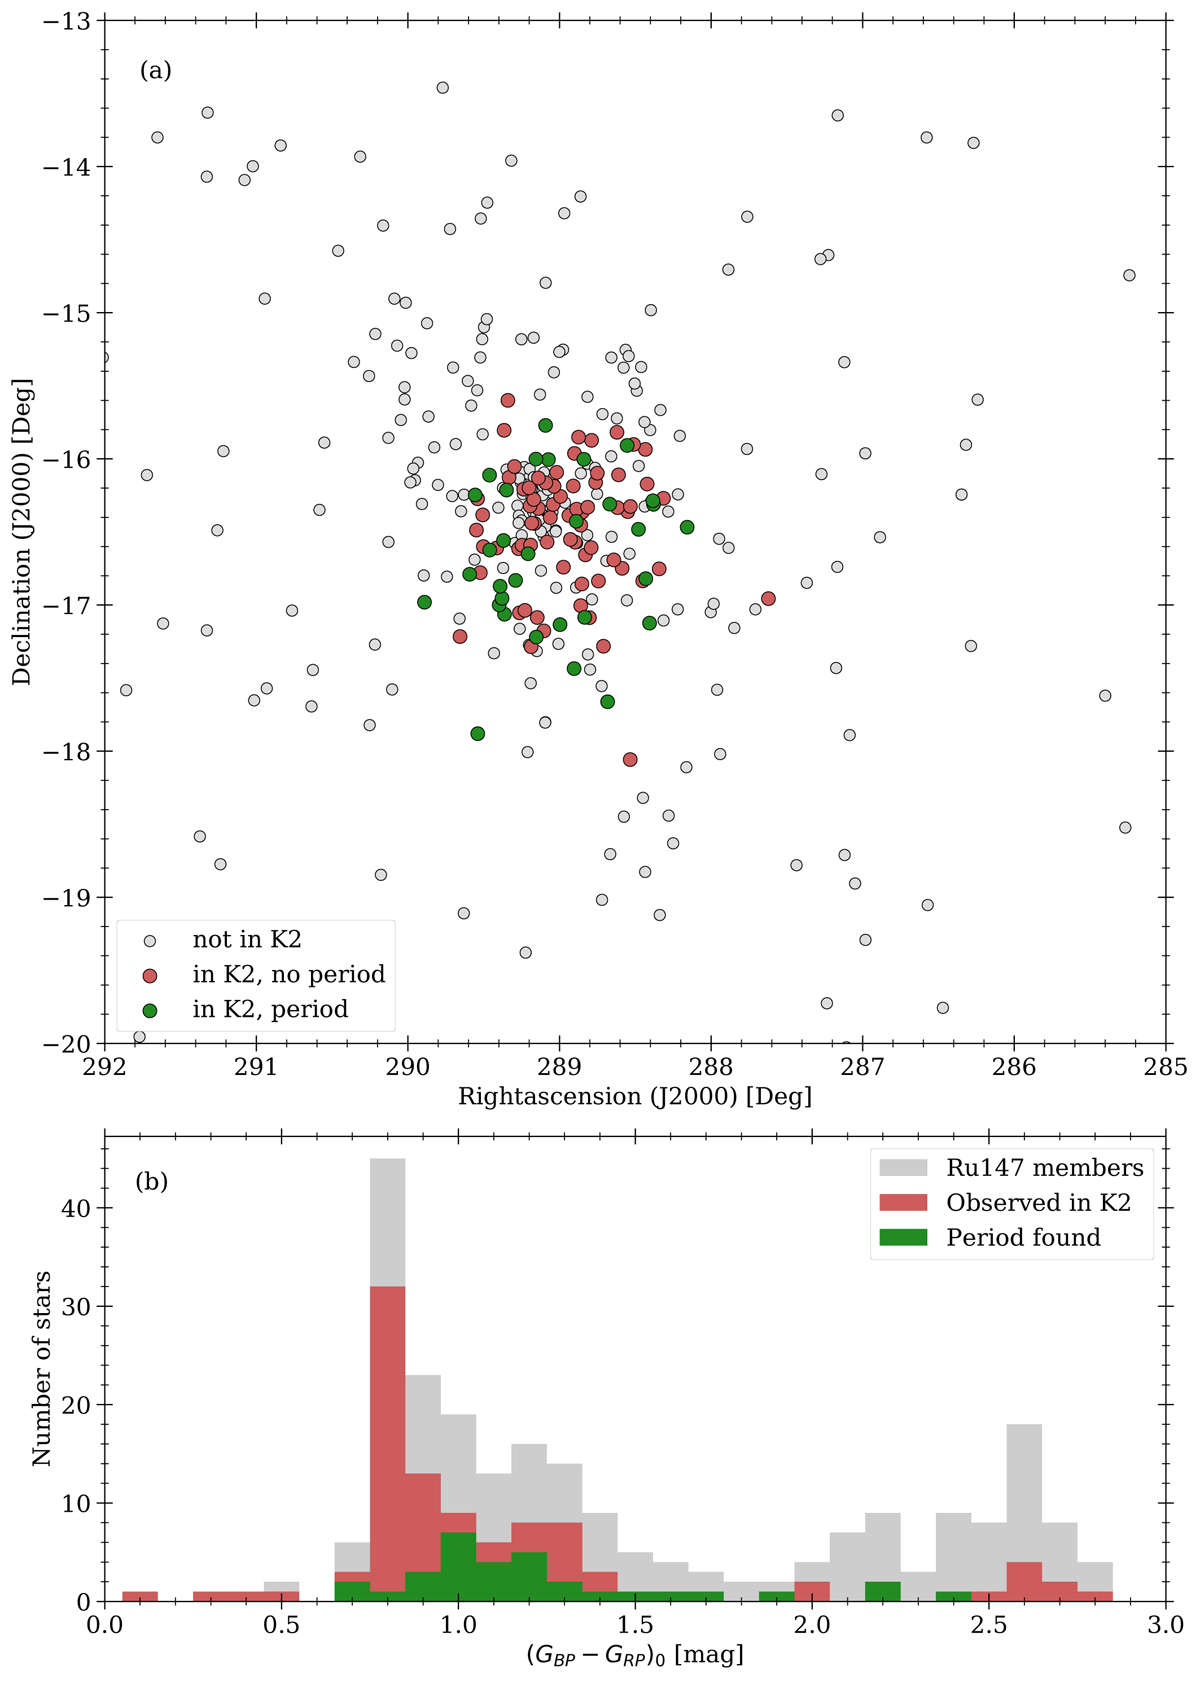
Fraction of stars with detected periods. Panel a: spatial distribution of the cluster stars, color coded to indicate both coverage in K2, and whether a periodic signal was identified (green) or not (red). Panel b: histogram of the stars identified as Ru147 members and its coverage in K2. Gray depicts all stars identified as Ru147 members in Sect. 2.2. Stars for which we found periodic signals are displayed in green, while red symbols indicate the remaining stars observed by Kepler/K2.
Current usage metrics show cumulative count of Article Views (full-text article views including HTML views, PDF and ePub downloads, according to the available data) and Abstracts Views on Vision4Press platform.
Data correspond to usage on the plateform after 2015. The current usage metrics is available 48-96 hours after online publication and is updated daily on week days.
Initial download of the metrics may take a while.