Fig. 6.
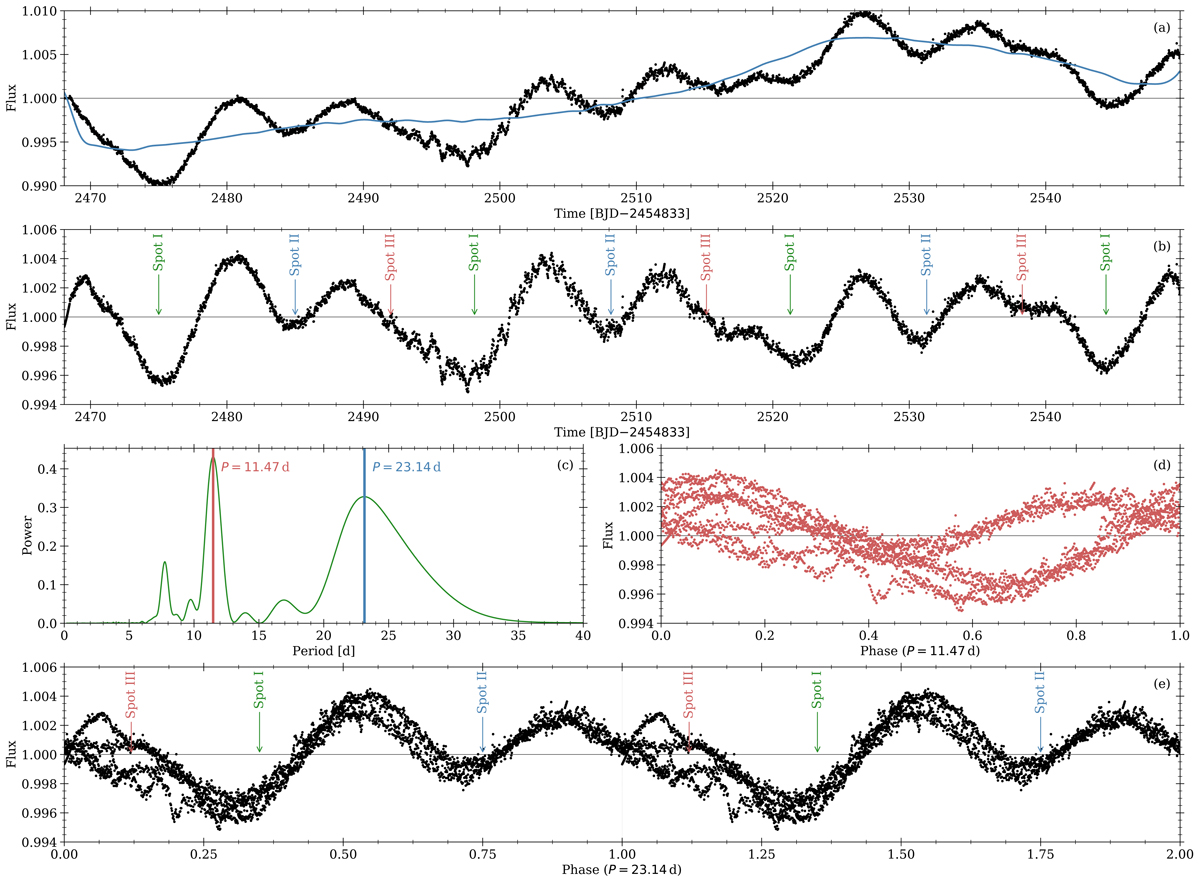
Light curve processing and period analysis for EPIC 219297228. The light curve exhibits a complex structure from multiple spot groups and spot evolution; panel a: EVEREST lightcurve (black) and the reconstruction from the PCA (blue). Panel b: PCA-corrected lightcurve (black) with large spot features marked. Panel c: result of a Lomb-Scargle analysis with the maximum in the power spectrum indicated in red and the period determined by manual inspection of the light curve in blue. Panels d and e: light curve phase folded with the periods obtained from the Lomb-Scargle and the manual inspection, respectively. For this particular light curve, the Lomb-Scargle analysis preferentially picks out half the true period of 23.14d, despite the clearly different shapes of the recognizable spot features.
Current usage metrics show cumulative count of Article Views (full-text article views including HTML views, PDF and ePub downloads, according to the available data) and Abstracts Views on Vision4Press platform.
Data correspond to usage on the plateform after 2015. The current usage metrics is available 48-96 hours after online publication and is updated daily on week days.
Initial download of the metrics may take a while.