Fig. D.1.
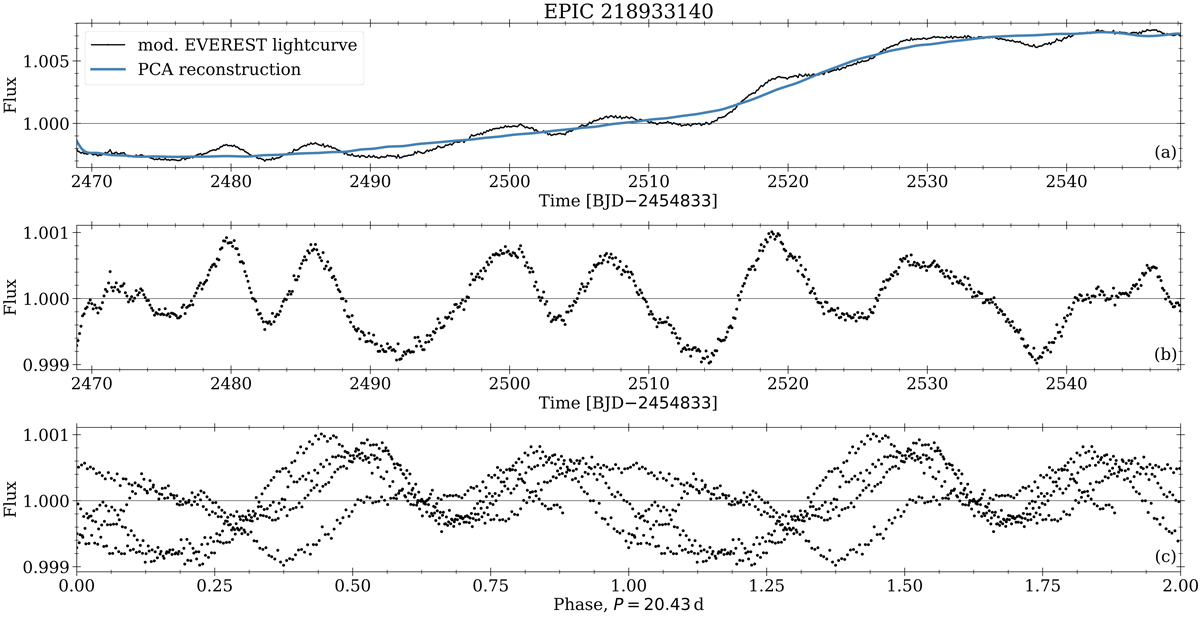
Light curve, PCA correction and phase plot for EPIC 218933140. Panel a: modified EVEREST light curve (black) and the reconstruction from the PCA (blue). The modifications for the PCA are applied as outlined Sect. 3.2. Panel b: corrected lightcurve and panel c: phase plot. For visibility reasons all data are displayed with a 0.1 d binning.
Current usage metrics show cumulative count of Article Views (full-text article views including HTML views, PDF and ePub downloads, according to the available data) and Abstracts Views on Vision4Press platform.
Data correspond to usage on the plateform after 2015. The current usage metrics is available 48-96 hours after online publication and is updated daily on week days.
Initial download of the metrics may take a while.