Fig. B.3.
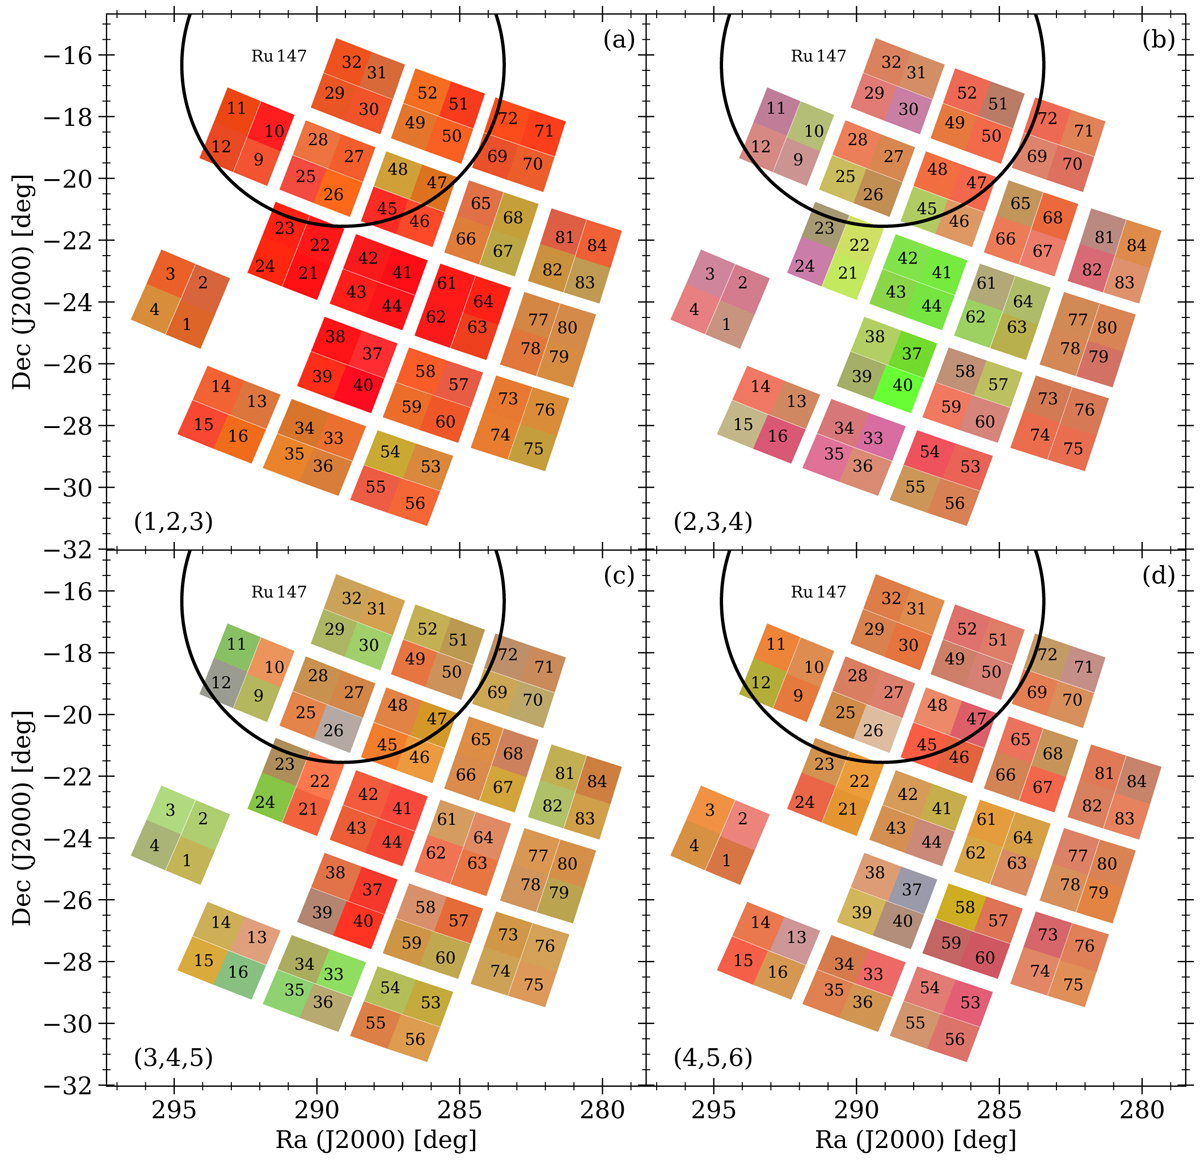
Spatial distribution of the observed trending in the EVEREST lightcurves of K2 C07. Each colored patch represents a channel with the corresponding number labeled. The color of each patch is based on the contribution of individual components. Here, the calculation works as follows: For each color, three components are adopted with their scaling factors from the PCA as RGB values. The numbers for each color are normalized to their maximum to guarantee a color range of 0–1. This is calculated for each lightcurve that is part of our basic sample (see text, Appendix B). We calculate a mean color and mean position of all lightcurves from each channel, which is then plotted. The channel number is plotted at the mean position. The difference between the individual panels are the components used for the RGB color. Panel a: red is given by component one, green by component two and blue by component three. For (b), (c), and (d), the components used are (2, 3, 4), (3, 4, 5), and (4, 5, 6), respectively. The position of Ru147 is indicated.
Current usage metrics show cumulative count of Article Views (full-text article views including HTML views, PDF and ePub downloads, according to the available data) and Abstracts Views on Vision4Press platform.
Data correspond to usage on the plateform after 2015. The current usage metrics is available 48-96 hours after online publication and is updated daily on week days.
Initial download of the metrics may take a while.