Fig. B.2.
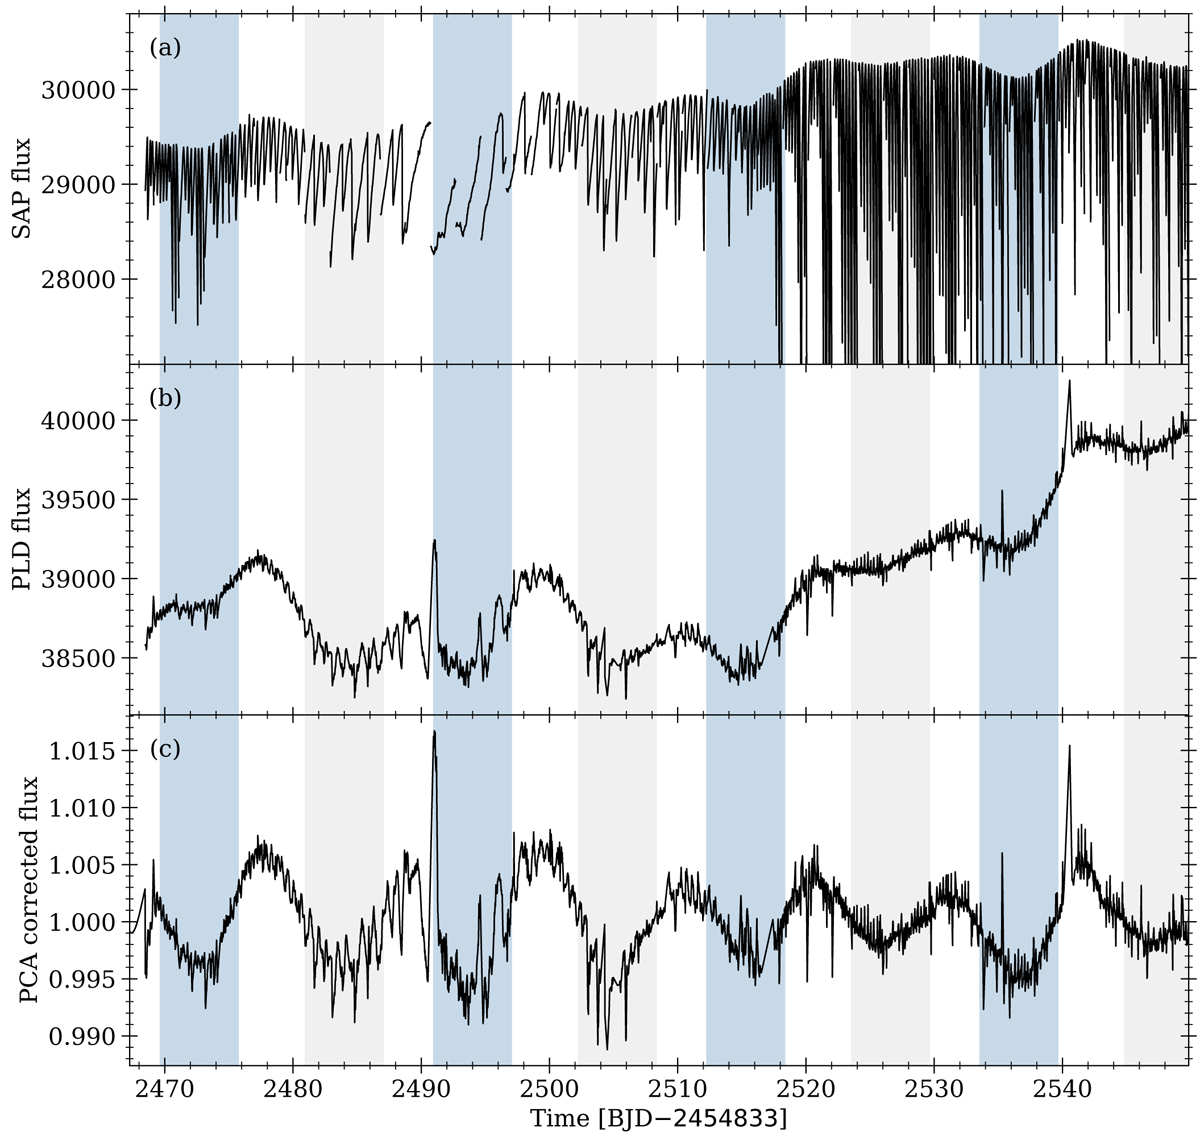
Example of the lightcurve correction process using EPIC 219722781. Panel a: original K2 lightcurve from simple aperture photometry (SAP). Panel b: EVEREST lightcurve after the pixel level de-correlation (PLD). Panel c: lightcurve after both normalization and principal component analysis (PCA). In all panels, the colored regions mark identified flux variations assigned to two different spots with a phase shift of 0.47 and a period of 21.3 d.
Current usage metrics show cumulative count of Article Views (full-text article views including HTML views, PDF and ePub downloads, according to the available data) and Abstracts Views on Vision4Press platform.
Data correspond to usage on the plateform after 2015. The current usage metrics is available 48-96 hours after online publication and is updated daily on week days.
Initial download of the metrics may take a while.