Fig. D.1
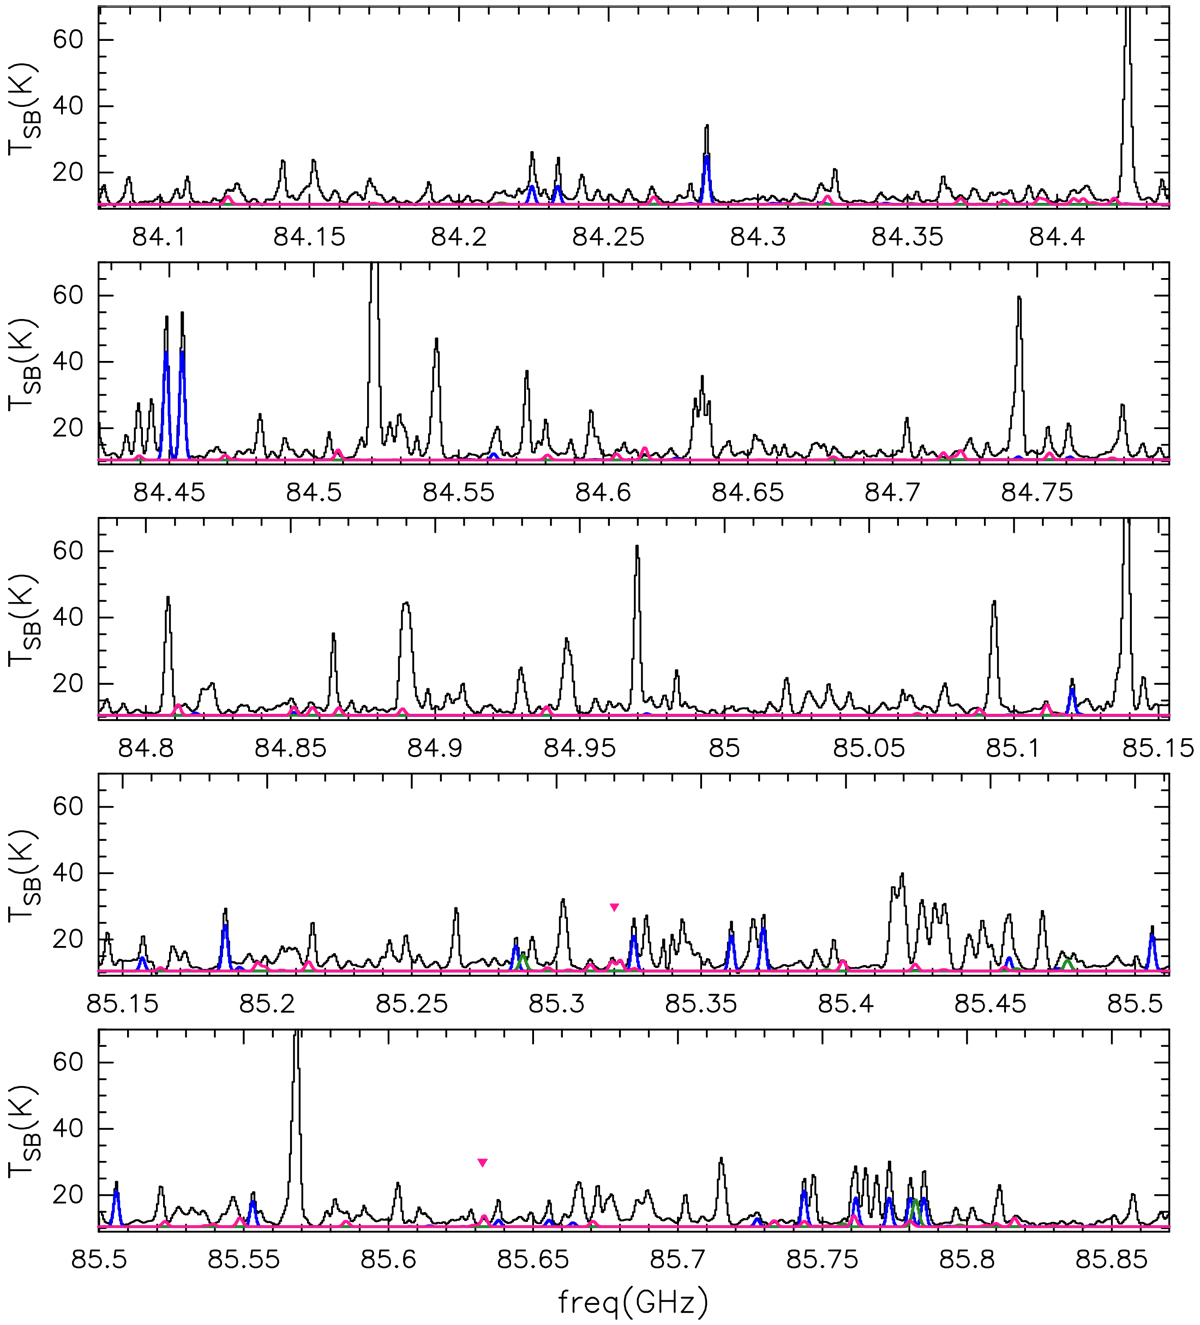
Total spectra of the GUAPOS project in black. In blue, we show the synthetic spectrum of the best fit of methyl formate (MF); in green the synthetic spectrum of the best fit of glycolaldehyde (GA); in pink the synthetic spectrum of the best fit of acetic acid (AA). The colored triangles indicate the transitions used to constrain the fitting procedure of the 3 different molecules. Closer views of those transitions are given in Figs. 5–7.
Current usage metrics show cumulative count of Article Views (full-text article views including HTML views, PDF and ePub downloads, according to the available data) and Abstracts Views on Vision4Press platform.
Data correspond to usage on the plateform after 2015. The current usage metrics is available 48-96 hours after online publication and is updated daily on week days.
Initial download of the metrics may take a while.