Fig. 10
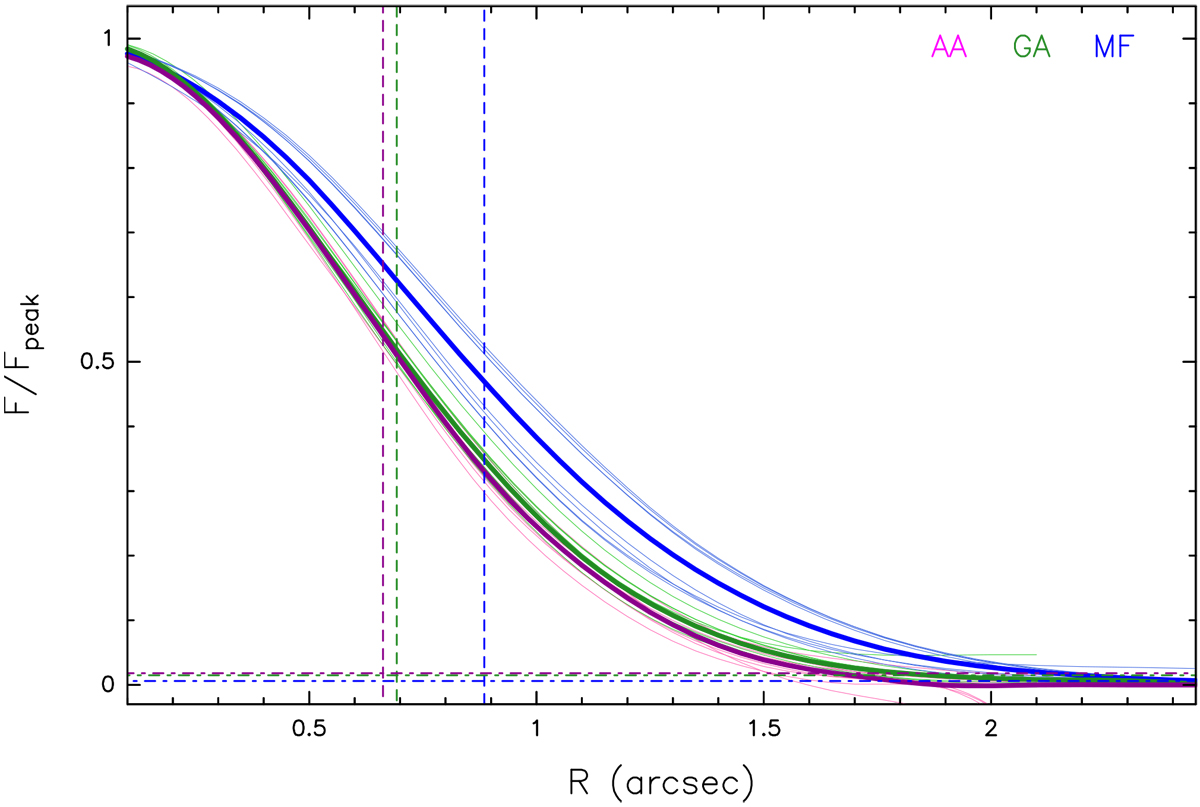
Relative flux of emission maps shown in Figs. 8 (thin lines) and 9 (bold lines) as a function of R. The dashed vertical lines indicate the mean value between the two semiaxes of the elliptic 2D fit of the mean maps, calculated from the values given in Table 3. At these radii the emission of the mean maps differs slightly from 0.5 due to the fact that the fluxes plotted are calculated in circular rings, for simplicity. The horizontal dashed lines show the 3 × rms level for the mean emission maps.
Current usage metrics show cumulative count of Article Views (full-text article views including HTML views, PDF and ePub downloads, according to the available data) and Abstracts Views on Vision4Press platform.
Data correspond to usage on the plateform after 2015. The current usage metrics is available 48-96 hours after online publication and is updated daily on week days.
Initial download of the metrics may take a while.