Fig. 3.
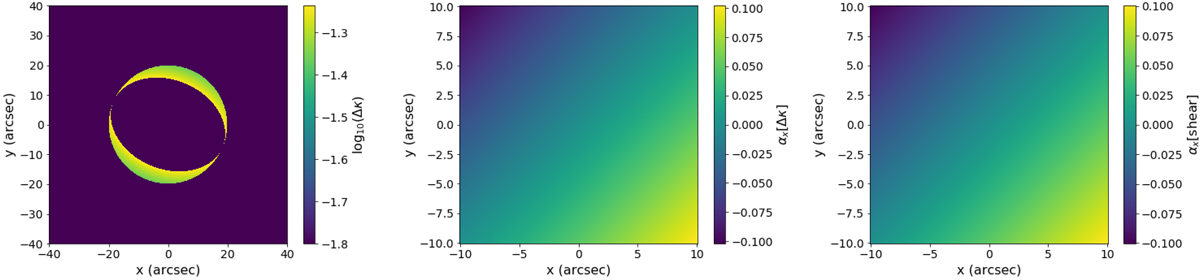
Comparison of the excess deflection appearing for a circular truncation with the deflection associated to a shear. Left: Δκ map for a circular truncation and underlying NIE density profile. Middle: αx map (first component of the deflection α vector) created using FFT convolution for Eq. (6) using Δκ. Right: αx map for a pure shear (Eq. (13)).
Current usage metrics show cumulative count of Article Views (full-text article views including HTML views, PDF and ePub downloads, according to the available data) and Abstracts Views on Vision4Press platform.
Data correspond to usage on the plateform after 2015. The current usage metrics is available 48-96 hours after online publication and is updated daily on week days.
Initial download of the metrics may take a while.