Fig. 8.
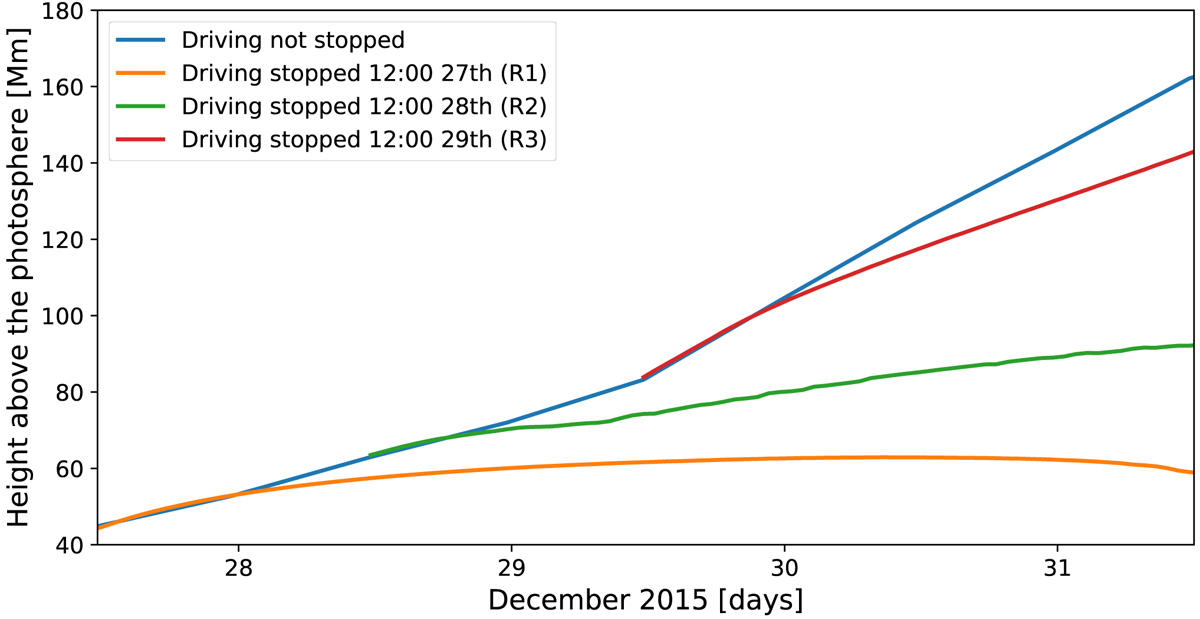
Temporal evolution of flux rope height above the photosphere. Displayed: relaxation simulations where the driving was stopped at 12:00 on 27 December (orange, R1), at 12:00 on 28 December (green, R2), at 12:00 on 29 December (red, R3), and the original simulation where driving was not stopped (blue).
Current usage metrics show cumulative count of Article Views (full-text article views including HTML views, PDF and ePub downloads, according to the available data) and Abstracts Views on Vision4Press platform.
Data correspond to usage on the plateform after 2015. The current usage metrics is available 48-96 hours after online publication and is updated daily on week days.
Initial download of the metrics may take a while.