Fig. 7.
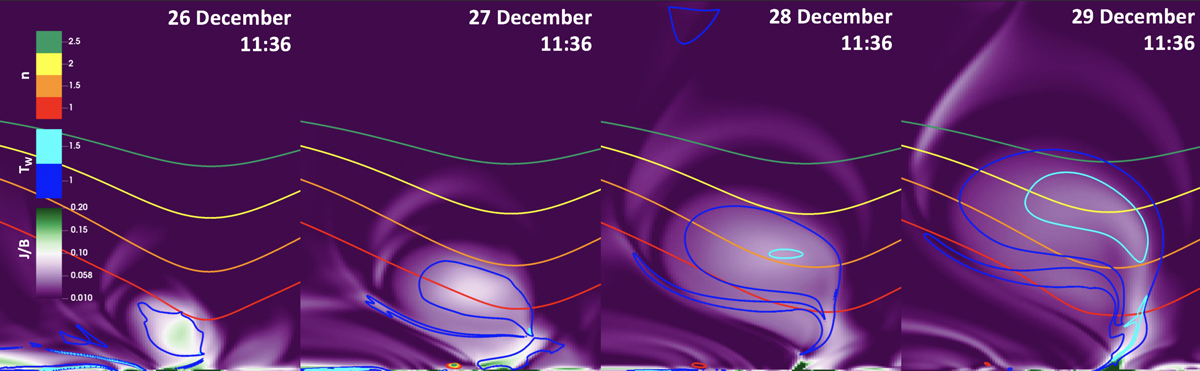
Simulation excerpts from 11:36 UT on 26 December to 11:36 UT on 29 December, with a spacing of 24 h between each image. The plane depicts the current density (purple to green), with approximately horizontal contours of decay index (red to green) and additional contours of Tw (blue and cyan). The plane is in the same position as the Tw plane in Fig. 5.
Current usage metrics show cumulative count of Article Views (full-text article views including HTML views, PDF and ePub downloads, according to the available data) and Abstracts Views on Vision4Press platform.
Data correspond to usage on the plateform after 2015. The current usage metrics is available 48-96 hours after online publication and is updated daily on week days.
Initial download of the metrics may take a while.