Fig. 6.
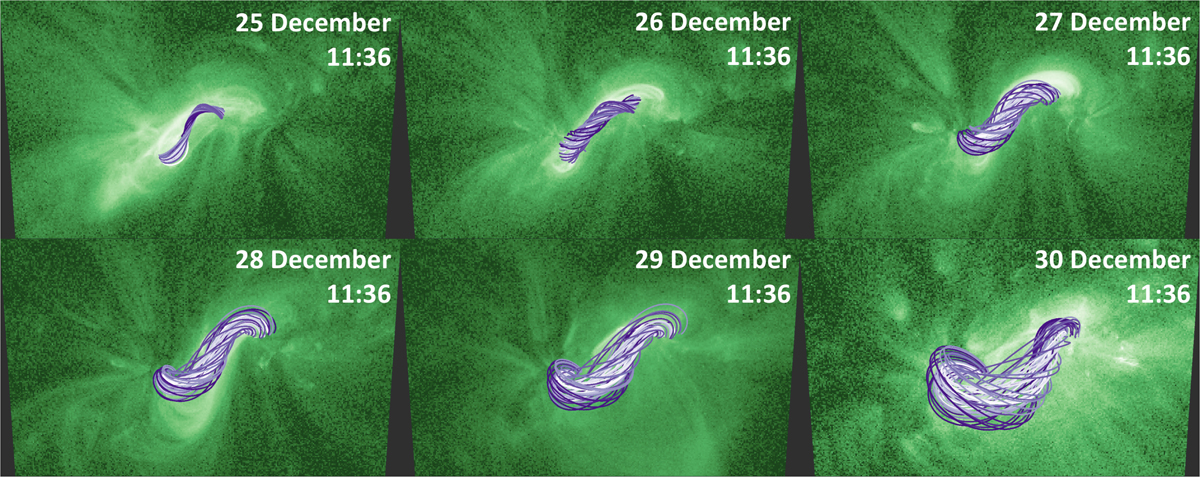
Simulated flux rope where Tw > 1.0 is shown in a series of six panels from 11:36 UT on 25 December to 11:36 UT on 30 December, with a spacing of 24 h between each image. The flux ropes are plotted on top of the closest available AIA 94 Å observations (within 1 min) for each time step.
Current usage metrics show cumulative count of Article Views (full-text article views including HTML views, PDF and ePub downloads, according to the available data) and Abstracts Views on Vision4Press platform.
Data correspond to usage on the plateform after 2015. The current usage metrics is available 48-96 hours after online publication and is updated daily on week days.
Initial download of the metrics may take a while.