Fig. 5.
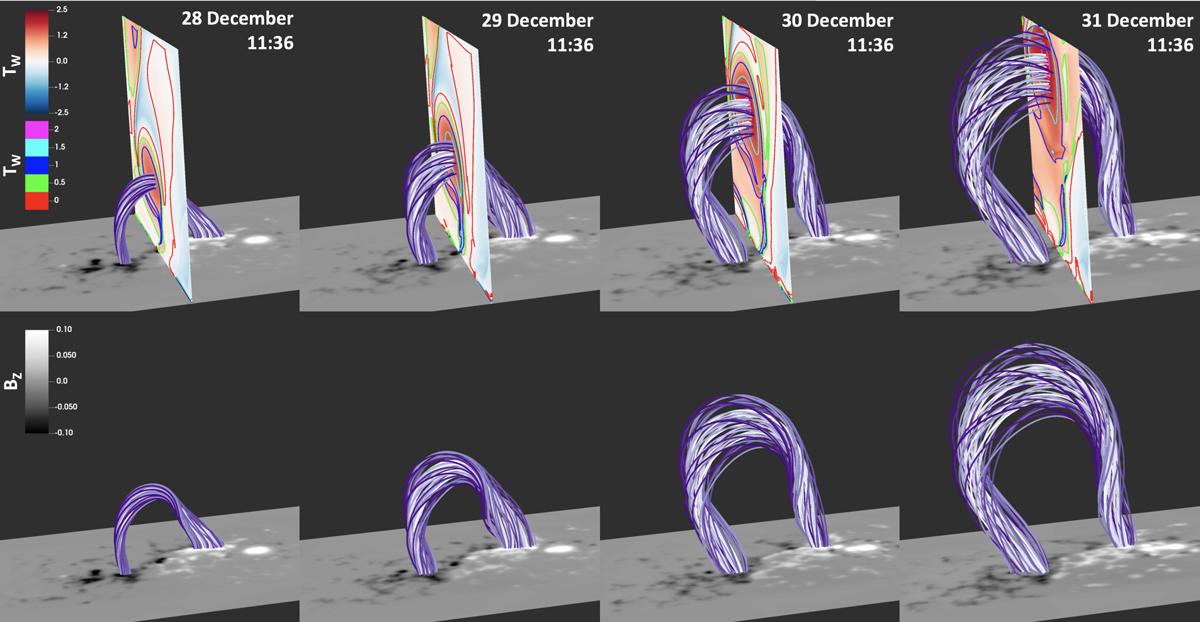
Simulation excerpts from 11:36 UT on 28 December to 11:36 UT on 31 December with a spacing of 24 h between each image. Top row: flux rope for field lines where Tw > 1.5. It is bisected by a plane of Tw that also plots the contours of Tw. Bottom row: unobstructed view of the flux rope from the same angle. All plots include a plane of Bz at the lower boundary of the domain. The Tw and Bz planes are available as online movies.
Current usage metrics show cumulative count of Article Views (full-text article views including HTML views, PDF and ePub downloads, according to the available data) and Abstracts Views on Vision4Press platform.
Data correspond to usage on the plateform after 2015. The current usage metrics is available 48-96 hours after online publication and is updated daily on week days.
Initial download of the metrics may take a while.