Fig. 4.
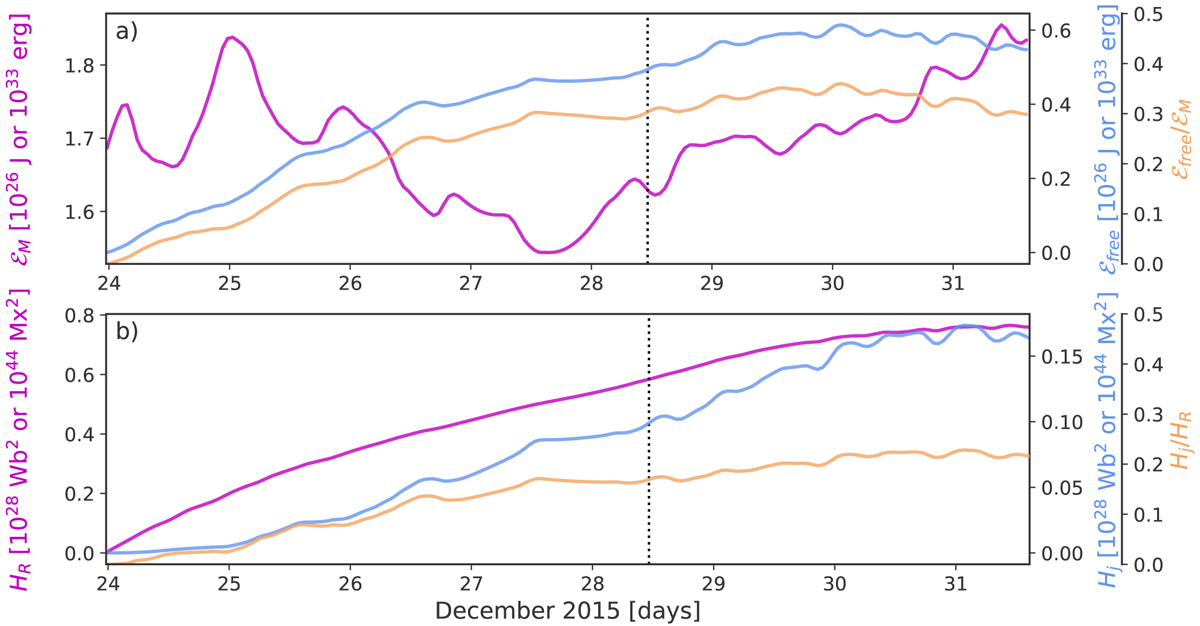
Temporal evolution of volume metrics showing (a) the free magnetic energy (blue), magnetic energy (purple), and the ratio of the free to the total magnetic energy (orange); and (b) the current-carrying helicity (blue), relative helicity (purple), and the ratio of the current-carrying to the relative helicity (orange) for AR 12473. The vertical dotted line indicates the time of the M1.9 flare.
Current usage metrics show cumulative count of Article Views (full-text article views including HTML views, PDF and ePub downloads, according to the available data) and Abstracts Views on Vision4Press platform.
Data correspond to usage on the plateform after 2015. The current usage metrics is available 48-96 hours after online publication and is updated daily on week days.
Initial download of the metrics may take a while.