Fig. 1.
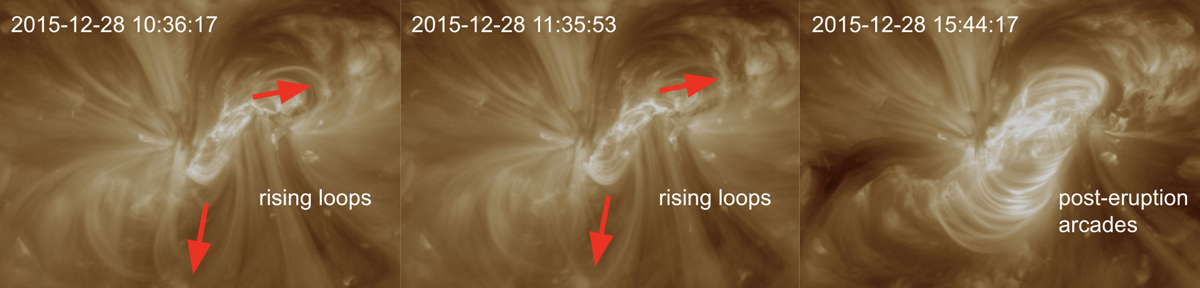
Series of AIA 193 Å observations depicting structures prior to the flare (left), shortly after the flare (middle), and four hours following the flare (right) that took place at approximately 11:20 UT. This figure is available as an online movie in the 94 Å and 193 Å channels.
Current usage metrics show cumulative count of Article Views (full-text article views including HTML views, PDF and ePub downloads, according to the available data) and Abstracts Views on Vision4Press platform.
Data correspond to usage on the plateform after 2015. The current usage metrics is available 48-96 hours after online publication and is updated daily on week days.
Initial download of the metrics may take a while.