Fig. 5
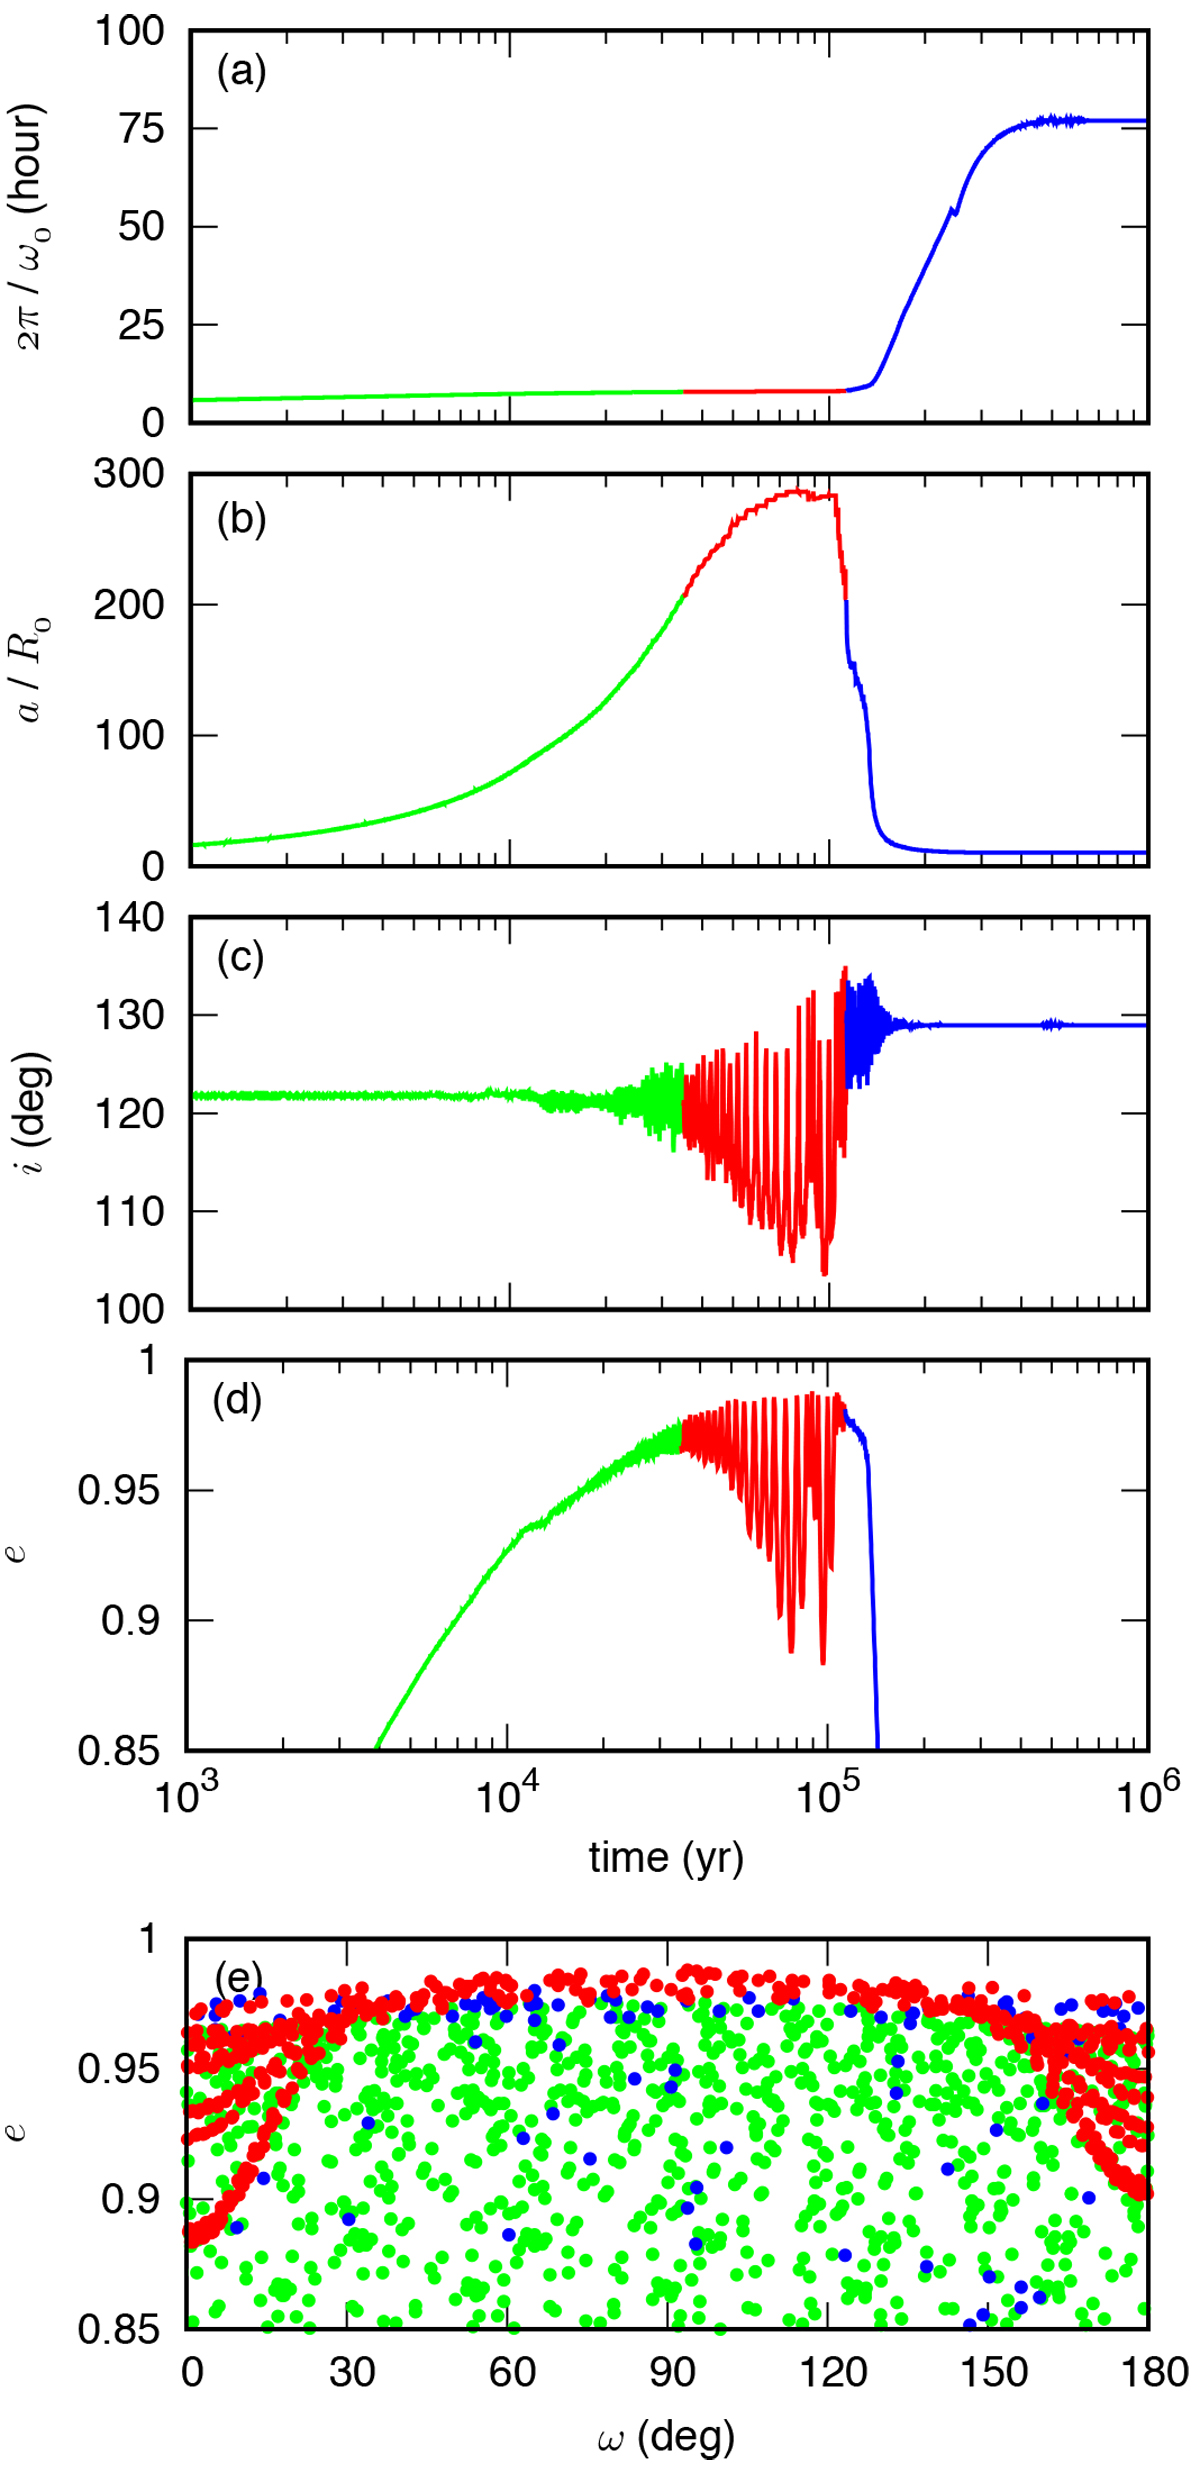
Tidal evolution of the Pluto–Charon binary for A = 1, initial θ0 ≈ 0° and orbit #1 (Table 1). We plot the evolution of Pluto’s rotation period (a), semi-major axis (b), inclination between orbital planes (c), and eccentricity (d) as a functionof time, and the evolution in the (e, ω) diagram (e). The different colors highlight the three evolution stages, initial semi-major axis and eccentricity increase (green), Lidov-Kozaicycles (red), final semi-major axis and eccentricity damping (blue).
Current usage metrics show cumulative count of Article Views (full-text article views including HTML views, PDF and ePub downloads, according to the available data) and Abstracts Views on Vision4Press platform.
Data correspond to usage on the plateform after 2015. The current usage metrics is available 48-96 hours after online publication and is updated daily on week days.
Initial download of the metrics may take a while.