Fig. 6.
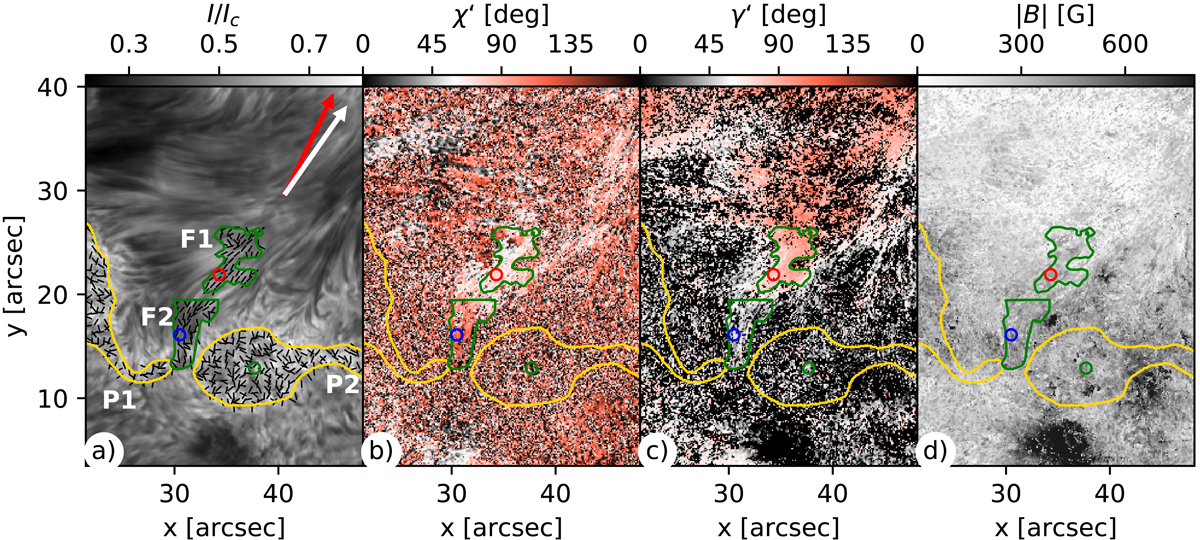
Magnetic field configuration. We mark the same regions as defined in Fig. 8. Additionally we mark one pixel in each of the regions that will be used for the calculation of the uncertainties (see Fig. 5). (a) Ca II 8542 Å line core image with the azimuth over-plotted in our regions of interest. White arrow: direction to disk center. Red arrow: angle between the two pores. (b) Azimuth, (c) inclination, and (d) absolute magnetic field.
Current usage metrics show cumulative count of Article Views (full-text article views including HTML views, PDF and ePub downloads, according to the available data) and Abstracts Views on Vision4Press platform.
Data correspond to usage on the plateform after 2015. The current usage metrics is available 48-96 hours after online publication and is updated daily on week days.
Initial download of the metrics may take a while.