Fig. 5.
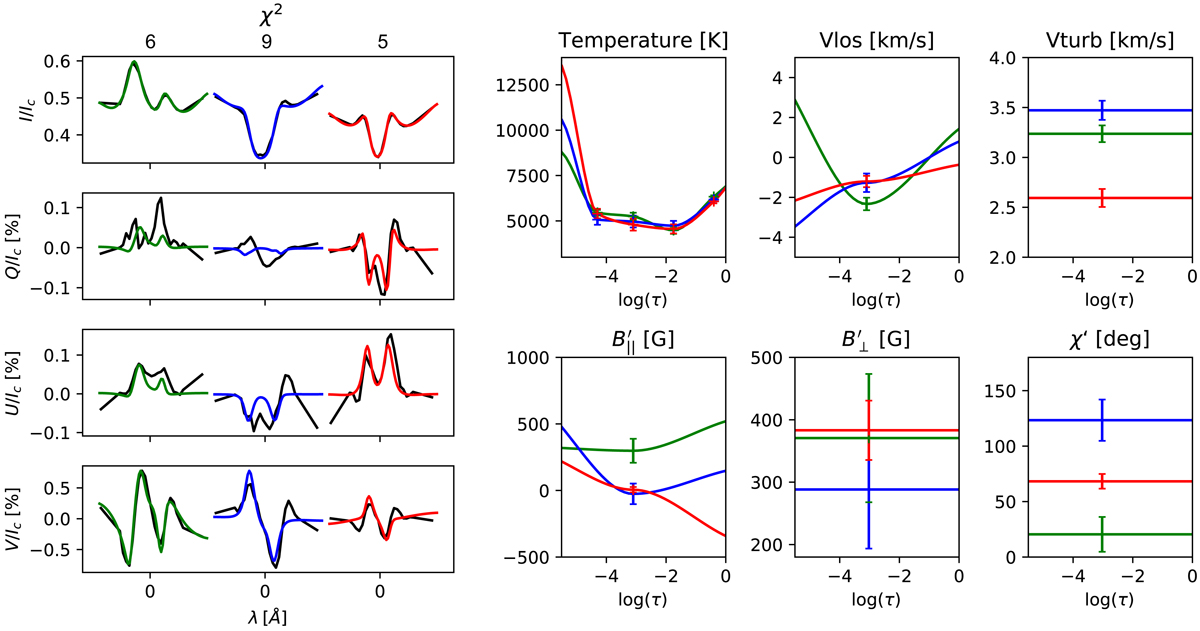
Left: typical observed stokes profiles in Ca II 8542 Å (black) and the fitted atmosphere (colored). Using Eq. (3) we get a χ2 value of 6, 9, and 5 for the three profiles respectively. The pixel locations of these profiles are marked in Fig. 6 with the same color coding. Right: inferred parameters displayed between log(τ) = [−5.5, 0]. The colors match the profiles on the left. The uncertainties for the same pixels based on Eq. (3) are indicated by vertical bars at their respective node.
Current usage metrics show cumulative count of Article Views (full-text article views including HTML views, PDF and ePub downloads, according to the available data) and Abstracts Views on Vision4Press platform.
Data correspond to usage on the plateform after 2015. The current usage metrics is available 48-96 hours after online publication and is updated daily on week days.
Initial download of the metrics may take a while.