Fig. 3.
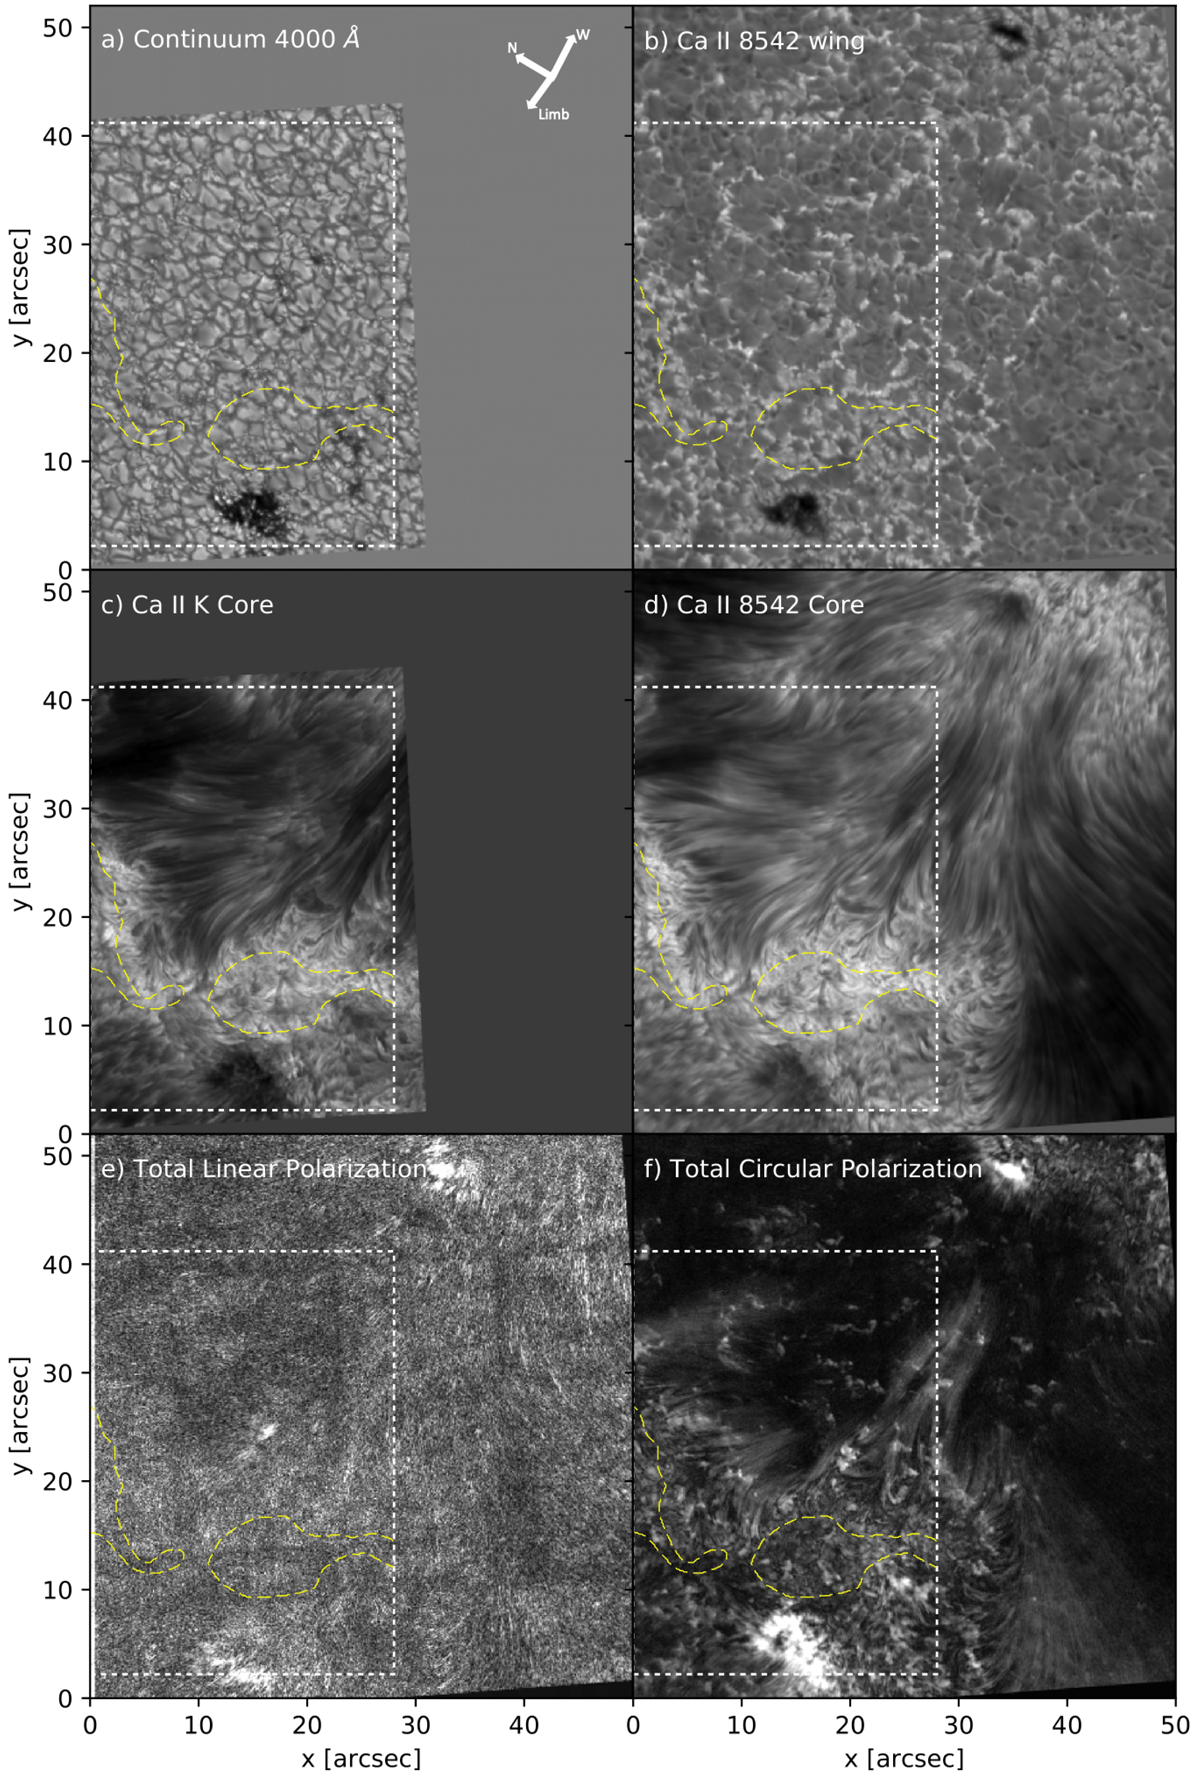
Overview of AR12713 taken on June 15th 2018 at 14:23 UT. Overlap between CHROMIS and CRISP is marked with a white rectangle. The plage areas P1 and P2 are marked with yellow contours. (a) Continuum intensity 4000 Å. (b) Ca II K core intensity. (c) Ca II K at Δλ = 0.26 Å. (d) Ca II 8542 Å line core intensity. (e) Total linear polarization based on the wavelength average of Stokes Q and U. (f) Total circular polarization based on the wavelength average of Stokes V.
Current usage metrics show cumulative count of Article Views (full-text article views including HTML views, PDF and ePub downloads, according to the available data) and Abstracts Views on Vision4Press platform.
Data correspond to usage on the plateform after 2015. The current usage metrics is available 48-96 hours after online publication and is updated daily on week days.
Initial download of the metrics may take a while.