Fig. 2.
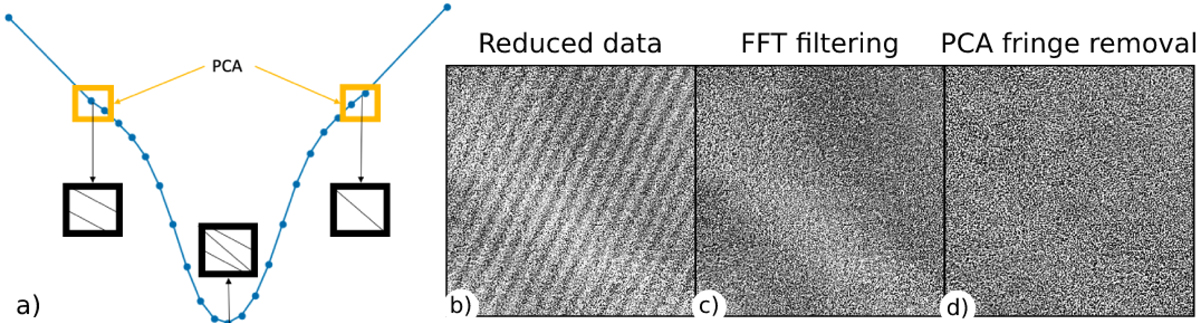
Fringe removal from reduced data. (a) A cartoon of the low-frequency fringe extraction process. Each wavelength point contains a linear combination of the fringes found in the left and right wing points, which are denoted by several lines. These fringes on either side could be extracted from the wings applying principle component analysis (PCA) to the outer most non-continuum wing points. A linear combination of these two fringes are then subtracted from the full spectrum. (b) A Stokes U line wing image showing both the high- and low-frequency fringes. (c) The same image after the high-frequency fringes have been removed with FFT (Fast Fourier transform) filtering. (d) The same image after the low-frequency fringe was removed using our PCA fringe removal technique.
Current usage metrics show cumulative count of Article Views (full-text article views including HTML views, PDF and ePub downloads, according to the available data) and Abstracts Views on Vision4Press platform.
Data correspond to usage on the plateform after 2015. The current usage metrics is available 48-96 hours after online publication and is updated daily on week days.
Initial download of the metrics may take a while.