Fig. 8
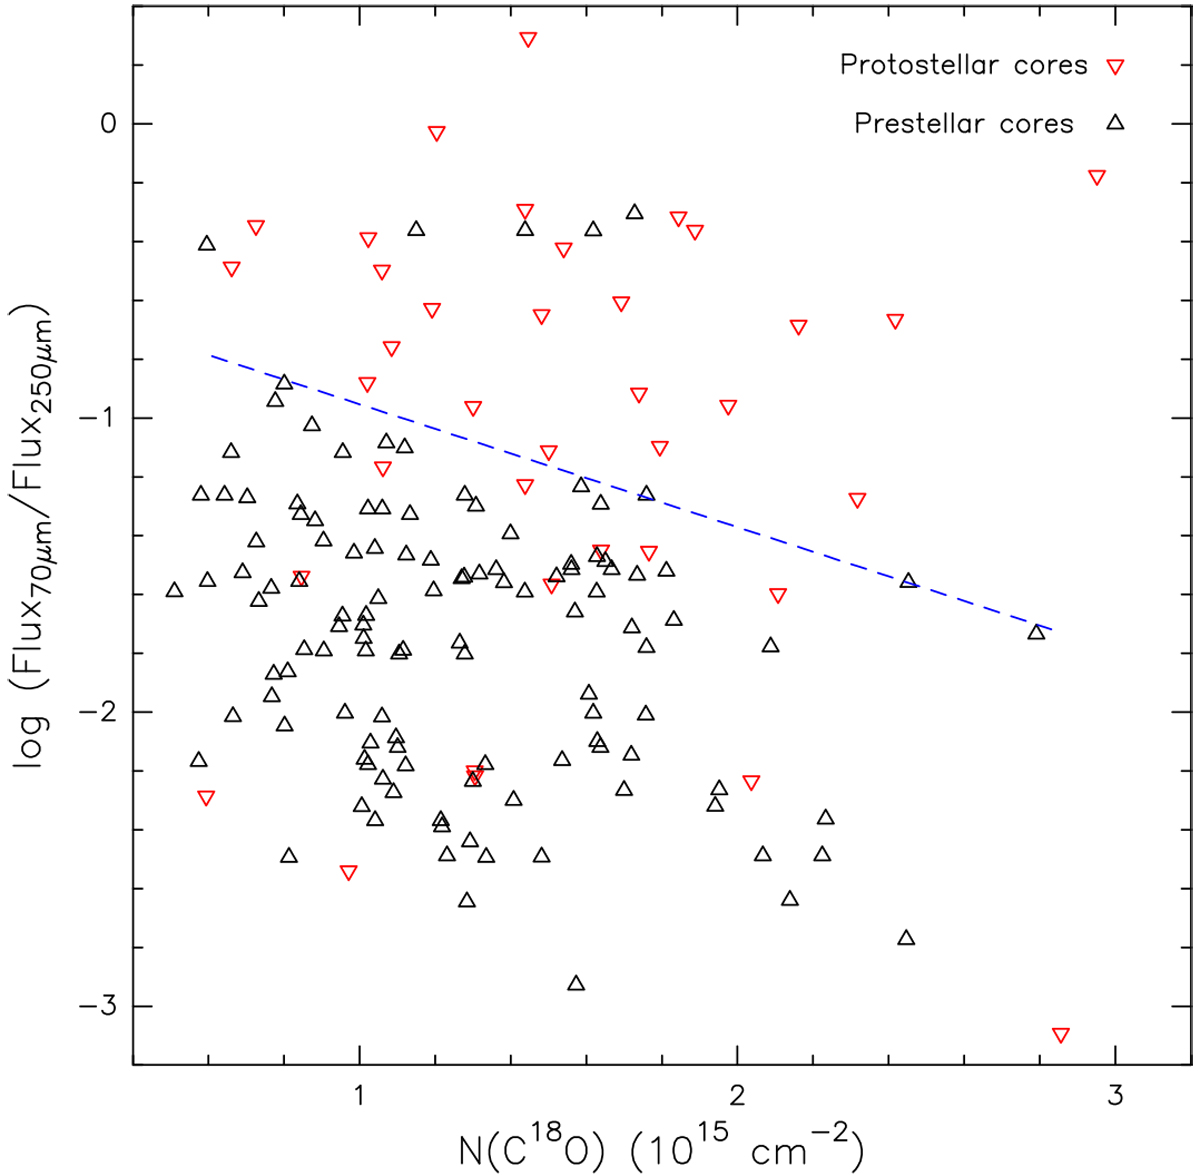
Column density of C18O vs. the peak fluxdensity ratio of the bandwidth of 70 and 250 μm of the protostellar (red triangles) and prestellar (black triangles) cores selected from Könyves et al. (2015). The dotted line indicates the dividing line between prestellar and protostellar cores and shows the gradual change of the ratio.
Current usage metrics show cumulative count of Article Views (full-text article views including HTML views, PDF and ePub downloads, according to the available data) and Abstracts Views on Vision4Press platform.
Data correspond to usage on the plateform after 2015. The current usage metrics is available 48-96 hours after online publication and is updated daily on week days.
Initial download of the metrics may take a while.