Fig. 11
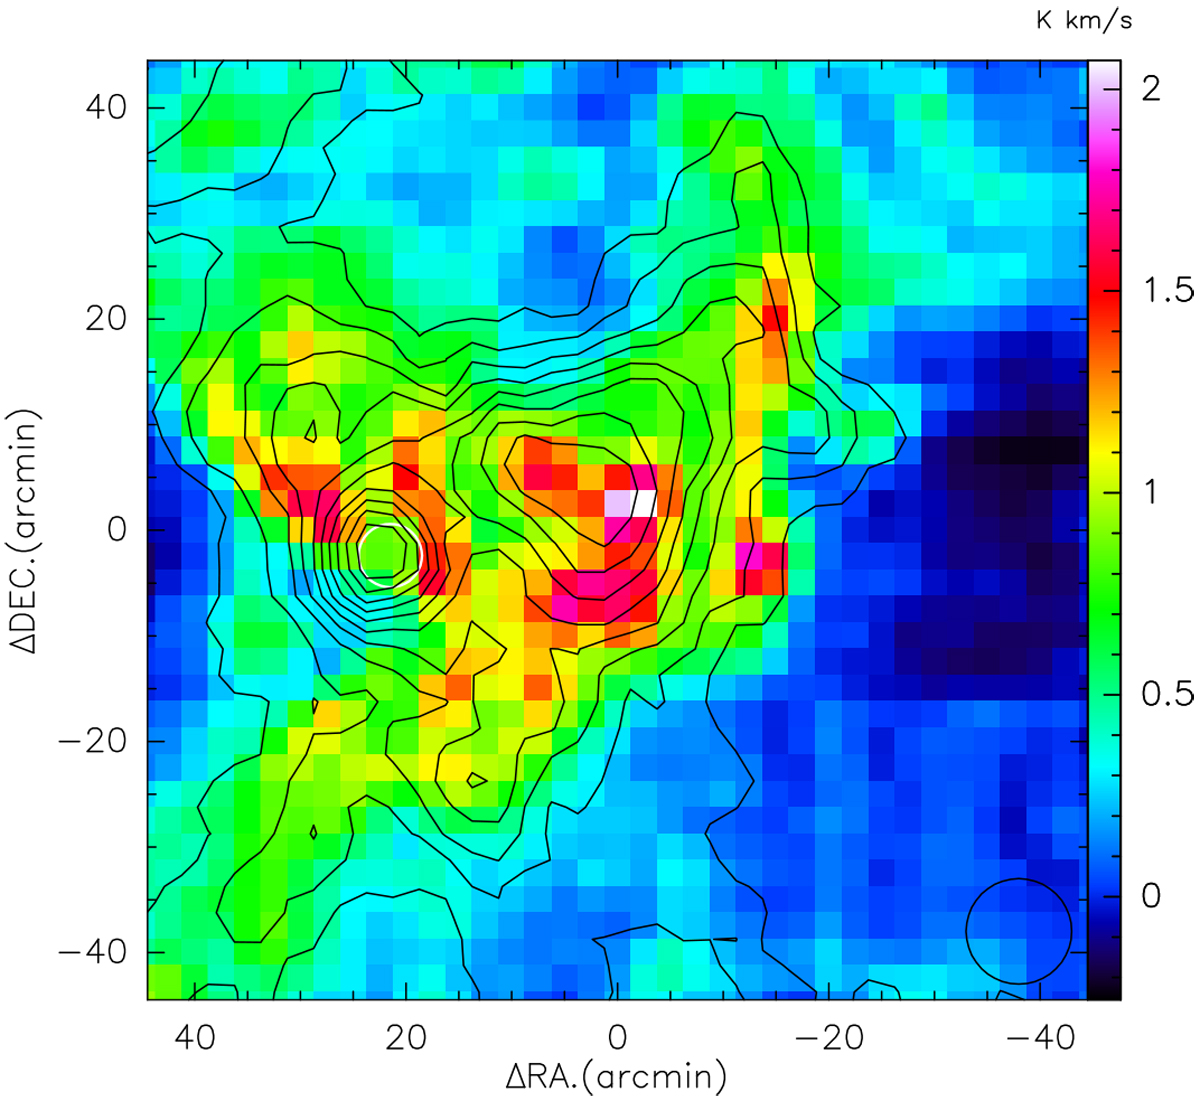
Map of the C18O(1−0) integrated intensity superposed on the contours of H2CO absorption toward the AMC. The C18O(1−0) and H2 CO data were smoothed to the same effective resolution and cell size of 10′ and 2.5′, respectively. Contour levels of the H2CO intensity map are −0.4 to − 1.8 in steps of −0.15 K km s−1. The white circle presents the location of the W 40 H II region (radius ∽3′) and the black circle in the bottom-right illustrates the resolution of 10′.
Current usage metrics show cumulative count of Article Views (full-text article views including HTML views, PDF and ePub downloads, according to the available data) and Abstracts Views on Vision4Press platform.
Data correspond to usage on the plateform after 2015. The current usage metrics is available 48-96 hours after online publication and is updated daily on week days.
Initial download of the metrics may take a while.