Fig. A.1.
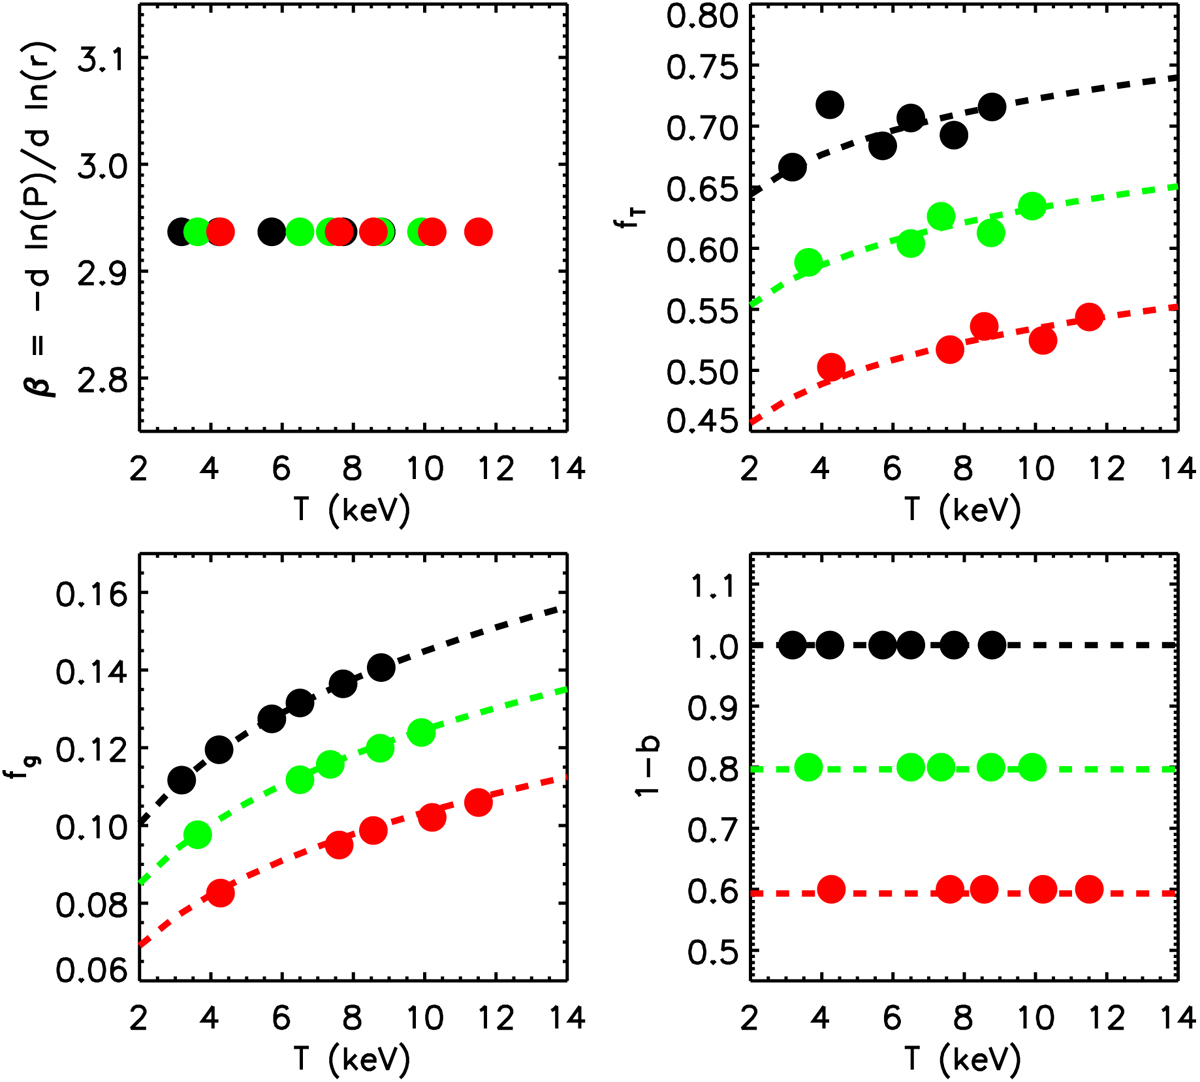
Distribution of the parameters β, fT, fg, and 1 − b as a function of T and colour-coded according to the assumed hydrostatic bias (black: b = 0; green: b = 0.2; red: b = 0.4). The dashed lines in the panel at the bottom right are recovered through the process described in Eq. (8). Points represent quantities derived for the following input values for (M500, z): (8 × 10¹⁴ M⊙, 0.05), (5 × 10¹⁴ M⊙, 0.05), (2 × 10¹⁴ M⊙, 0.05), (8 × 10¹⁴ M⊙, 0.5), (5 × 10¹⁴ M⊙, 0.5), with and without a bias b; a further case (2 × 10¹⁴ M⊙, 1) with b = 0 is considered.
Current usage metrics show cumulative count of Article Views (full-text article views including HTML views, PDF and ePub downloads, according to the available data) and Abstracts Views on Vision4Press platform.
Data correspond to usage on the plateform after 2015. The current usage metrics is available 48-96 hours after online publication and is updated daily on week days.
Initial download of the metrics may take a while.