Free Access
Fig. 7.
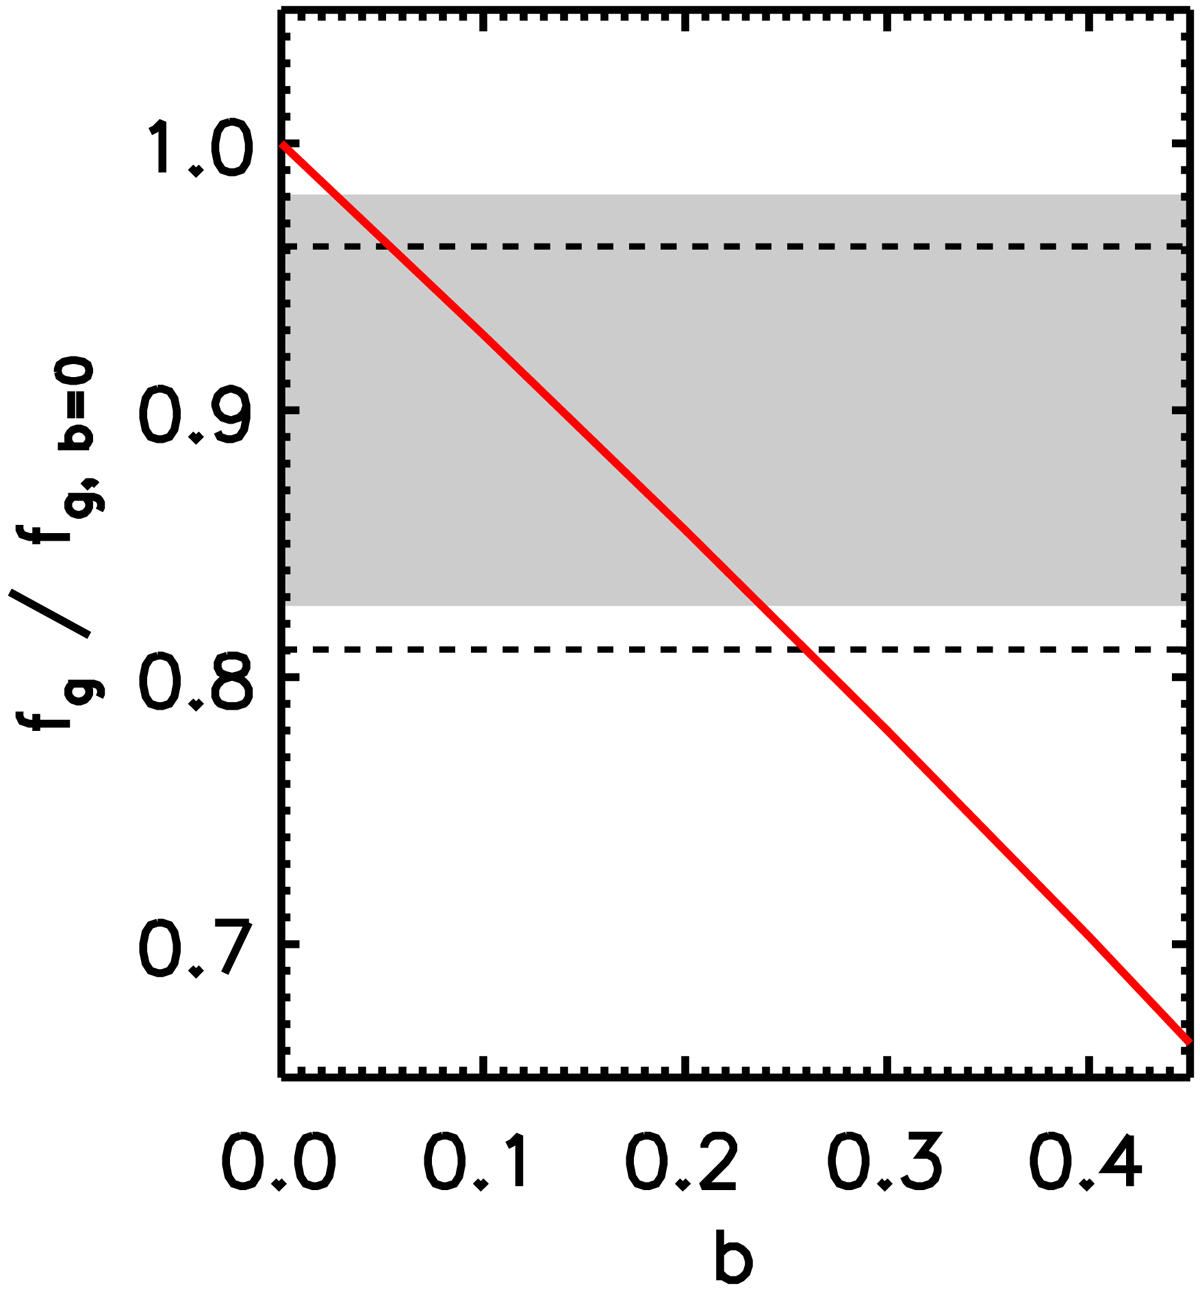
Dependence of the normalisation of fg upon the bias b (red line; see Eq. (15)). The shaded region (and the region between dashed lines) represents the quantity fnc/fg, b = 0, where ![]() , with fg ≈ 0.123, fg, b = 0 = 0.124 (0.126) and 1 < C0 < 1.4 being the 1σ upper limit on the level of gas clumping.
, with fg ≈ 0.123, fg, b = 0 = 0.124 (0.126) and 1 < C0 < 1.4 being the 1σ upper limit on the level of gas clumping.
Current usage metrics show cumulative count of Article Views (full-text article views including HTML views, PDF and ePub downloads, according to the available data) and Abstracts Views on Vision4Press platform.
Data correspond to usage on the plateform after 2015. The current usage metrics is available 48-96 hours after online publication and is updated daily on week days.
Initial download of the metrics may take a while.