Fig. 6.
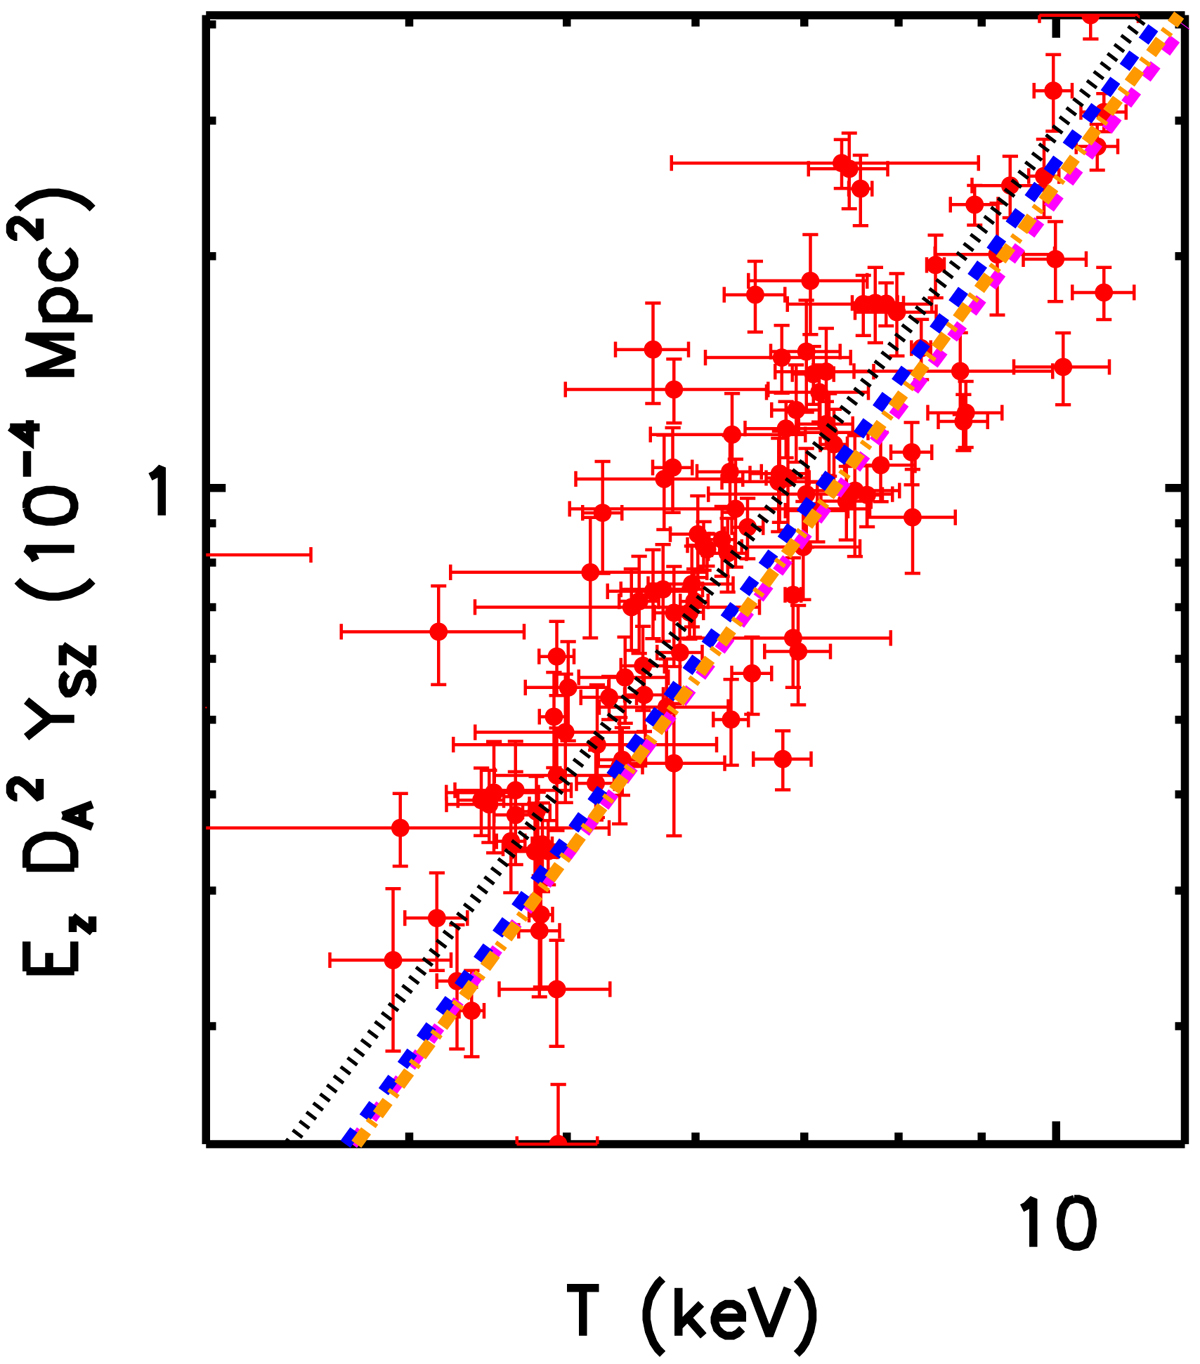
YSZ − T relation for the ESZ sample with the best-fit results from a linear fit in the logarithmic space. The fit on the observed data is performed using LIRA (black dotted line). The predictions from the semi-analytic model overlap (magenta dashed line: D14 model; blue dashed line: B13 model). The dot-dashed orange line is obtained from the propagation of the scaling in the E15 formalism (see Eq. (13)).
Current usage metrics show cumulative count of Article Views (full-text article views including HTML views, PDF and ePub downloads, according to the available data) and Abstracts Views on Vision4Press platform.
Data correspond to usage on the plateform after 2015. The current usage metrics is available 48-96 hours after online publication and is updated daily on week days.
Initial download of the metrics may take a while.