Fig. 5.
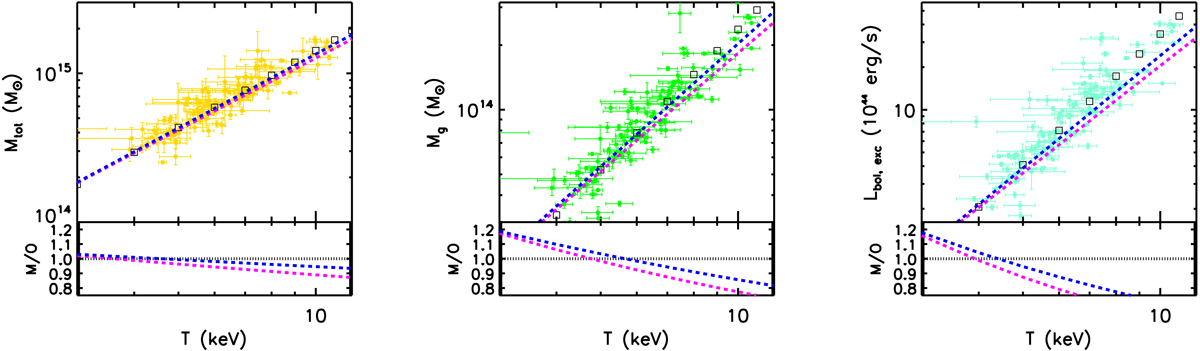
Distribution of the observed values for the ESZ sample with best-fit results from a linear fit in the logarithmic space (using LIRA; Sereno 2016). Predictions from the semi-analytic model (best-fit values in Table 3) are overplotted with dashed lines in magenta (for the D14 c − M − z relation) and blue (B13). Bottom panels: dashed lines indicate the ratios of the model (M) to the observed (O) best-fit relations.
Current usage metrics show cumulative count of Article Views (full-text article views including HTML views, PDF and ePub downloads, according to the available data) and Abstracts Views on Vision4Press platform.
Data correspond to usage on the plateform after 2015. The current usage metrics is available 48-96 hours after online publication and is updated daily on week days.
Initial download of the metrics may take a while.