Fig. 3.
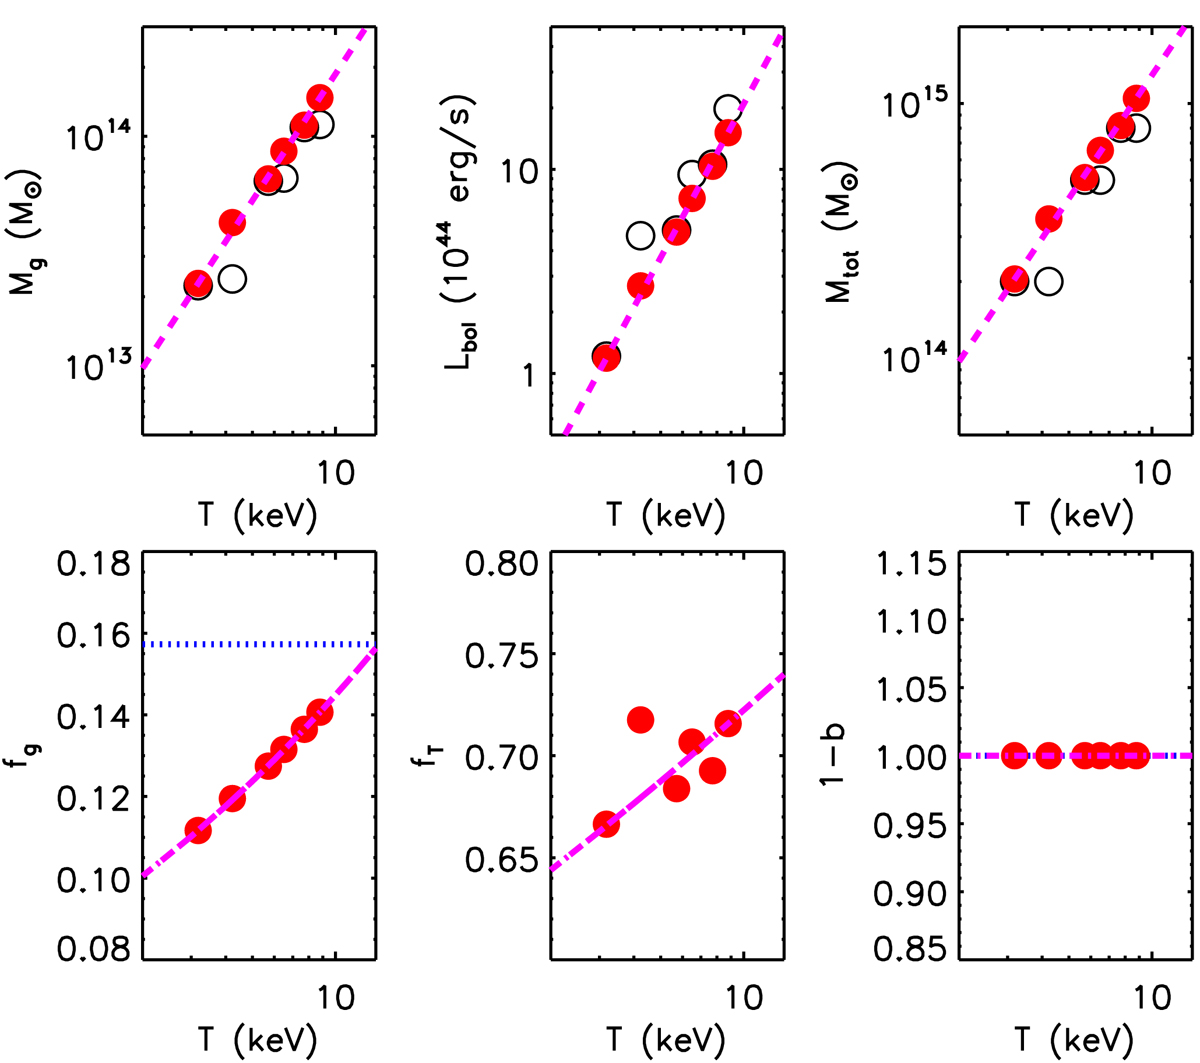
Top panels: global properties (empty black dots) and after correction for the Ez factor (solid red dots) recovered from their thermodynamic profiles for the following input values for (M500, z): (8 × 10¹⁴ M⊙, 0.05), (5 × 10¹⁴ M⊙, 0.05), (2 × 10¹⁴ M⊙, 0.05), (8 × 10¹⁴ M⊙, 0.5), (5 × 10¹⁴ M⊙, 0.5), (2 × 10¹⁴ M⊙, 1). The dashed magenta lines identify the best-fit relations of Eq. (7). A core-excised bolometric luminosity is considered. Bottom panels: red dots are the quantities (from left to right: fg, fT, b) estimated in our model for the following input values for (M500, z): (8 × 10¹⁴ M⊙, 0.05), (5 × 10¹⁴ M⊙, 0.05), (2 × 10¹⁴ M⊙, 0.05), (8 × 10¹⁴ M⊙, 0.5), (5 × 10¹⁴ M⊙, 0.5), and (2 × 10¹⁴ M⊙, 1); the blue dotted line indicates Ωb/Ωm = 0.157 (Planck Collaboration XXVII 2016); the dashed magenta lines show the predictions following the relations: fg = 0.124 𝒯0.23, fT = 0.687 𝒯0.07 and 1 − b = h0 = 1, where fg and fT are the absolute values, i.e. multiplied by the assumed normalisations of 0.1 and ![]() , respectively.
, respectively.
Current usage metrics show cumulative count of Article Views (full-text article views including HTML views, PDF and ePub downloads, according to the available data) and Abstracts Views on Vision4Press platform.
Data correspond to usage on the plateform after 2015. The current usage metrics is available 48-96 hours after online publication and is updated daily on week days.
Initial download of the metrics may take a while.