Fig. 2.
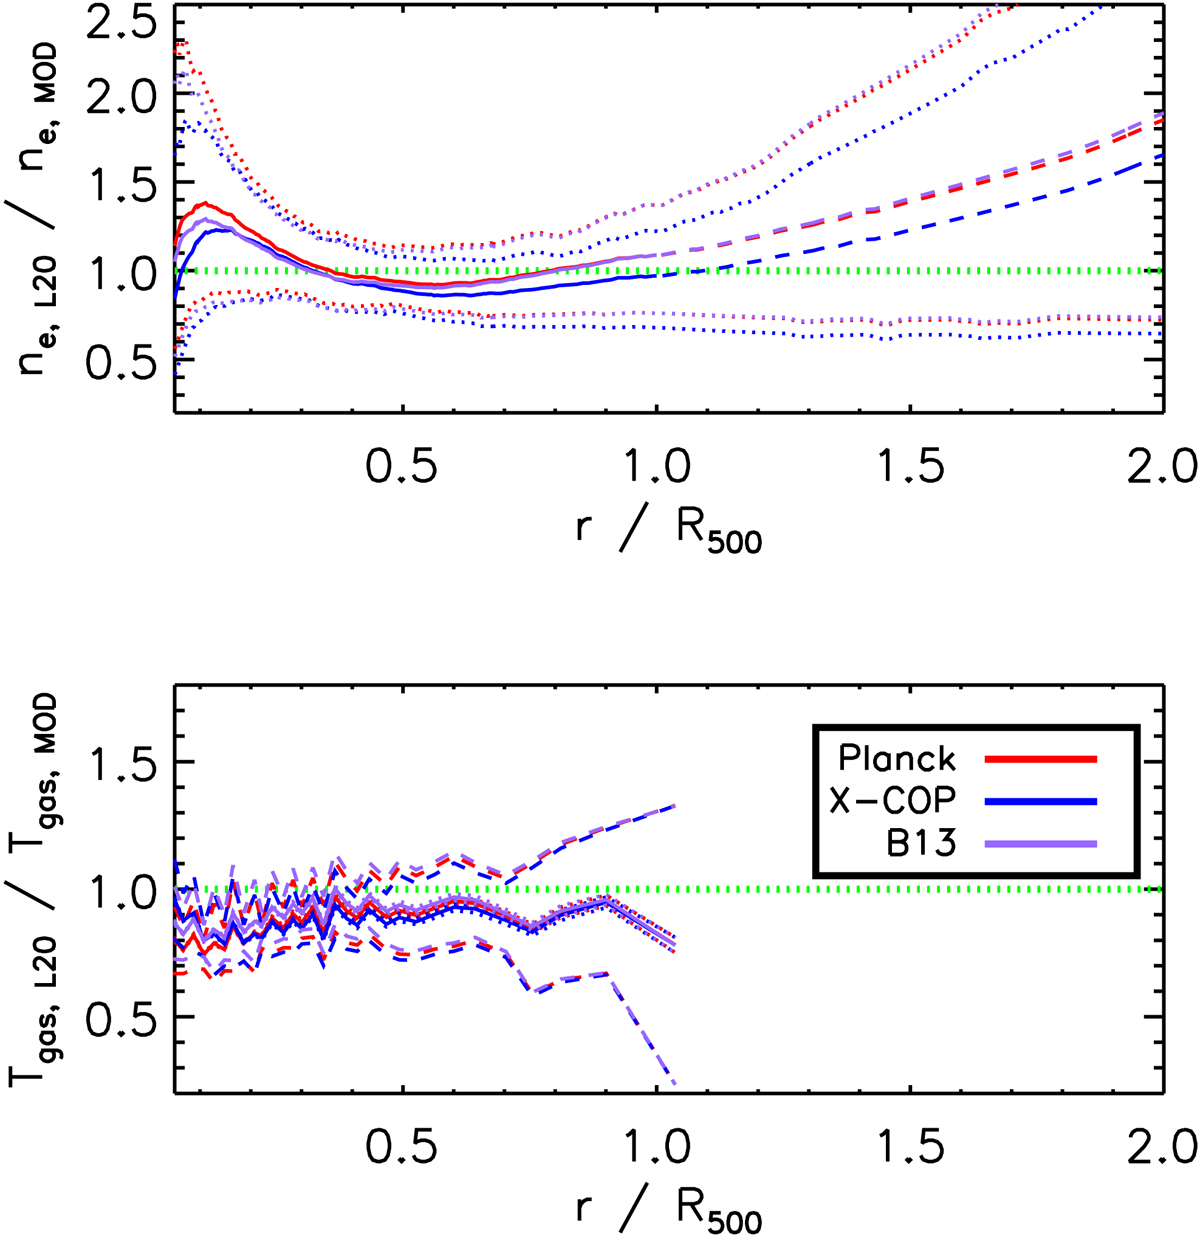
Comparisons between the stacked profiles from the 120 objects analysed for the ESZ sample in Lovisari et al. (2020) and predictions from different models of (i) the universal pressure profile (Planck, used as reference, and X-COP) and (ii) the c − M − z relation (D14, used as reference, and B13) estimated at the median values in the sample of M500 and redshift. Top panel: electron density profiles recovered from the best-fit parameters of a double-β model. The solid line indicates the median value at each radius; the dotted lines show the 16th and 84th percentile estimated at each radius. The dashed line represents the extrapolation beyond the observational limit for the sample. Bottom panel: stacked temperature profile obtained from the weighted mean of 30 spectral points in each bin. Errors on the mean and dispersion (dotted lines) are overplotted.
Current usage metrics show cumulative count of Article Views (full-text article views including HTML views, PDF and ePub downloads, according to the available data) and Abstracts Views on Vision4Press platform.
Data correspond to usage on the plateform after 2015. The current usage metrics is available 48-96 hours after online publication and is updated daily on week days.
Initial download of the metrics may take a while.